 Violent
Property
Total
Violent
Property
Total
Quick answer
According to crimebycity.com's analysis of FBI 2024 crime data, Lawrence, MA has a Safety Score of 59/100 — safer than 59% of US cities — with a total crime rate of 1,438.6 per 100,000 residents, ranking #1,233 of 2,971 US cities and #147 of 186 in Massachusetts.
Safety Score
Violent Crime Rate
Property Crime Rate
Is Lawrence, Massachusetts Safe?
Lawrence, a Merrimack Valley city, was once a thriving textile hub, home to the historic Bread and Roses Strike. Today, it is a diverse community with a significant Hispanic population.
Lawrence has a safety score of 59/100 (Near National Average). Based on FBI data for 2024, the city reported a total crime rate of 1,438.6 per 100,000 residents, compared to the national average of 2,752.3 per 100,000.
Lawrence ranks #147 out of 186 cities in Massachusetts and #1233 out of 2971 nationally (safest first). This places it in the 59th percentile for safety — safer than 59% of US cities.
The most elevated crime category in Lawrence is murder, at 7.8 per 100K — 1.3x the national average. Conversely, motor vehicle theft is relatively low at just 0.2x the national rate.
Year over year, Lawrence's total crime rate decreased by 6.9%, with violent crime declining 8.3%.
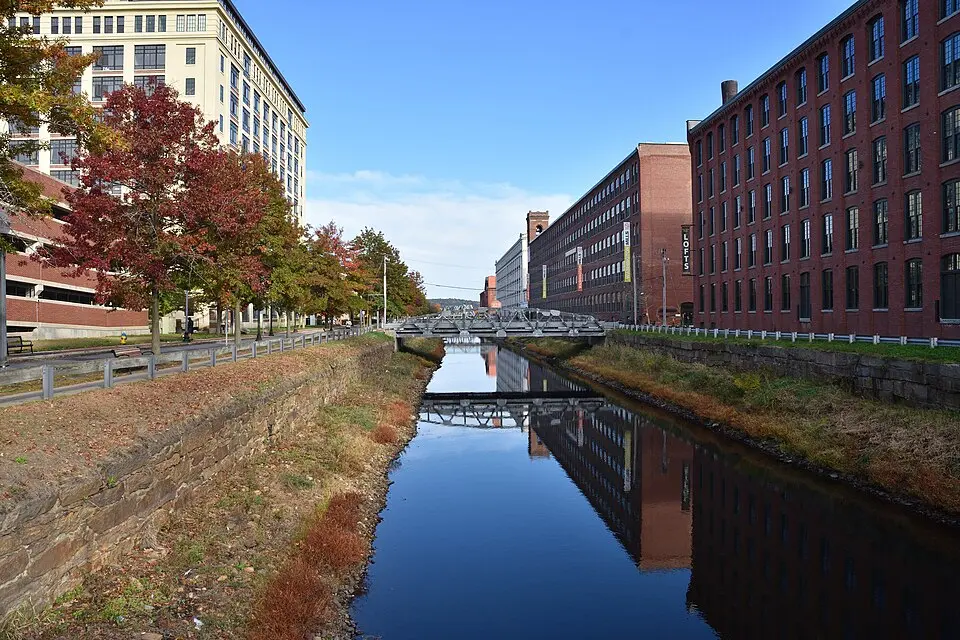
Photo: Wikimedia Commons
Lawrence Crime Statistics Breakdown (2024)
| Crime Type | Incidents | Rate per 100K | National Avg |
|---|---|---|---|
| Violent Crime | 394 | 439.7 | 473.3 |
| Murder | 7 | 7.8 | 6.2 |
| Rape | 28 | 31.3 | 43.4 |
| Robbery | 47 | 52.5 | 93.0 |
| Aggravated Assault | 312 | 348.2 | 330.0 |
| Property Crime | 895 | 998.9 | 2,279.1 |
| Burglary | 65 | 72.5 | 287.8 |
| Larceny-Theft | 763 | 851.6 | 1,638.9 |
| Motor Vehicle Theft | 67 | 74.8 | 352.4 |
| Arson | 0 | 0.0 | 0.0 |
Lawrence vs Massachusetts Average
How does Lawrence's crime rate compare to the Massachusetts state average?
| Metric | Lawrence | Massachusetts Avg | Difference |
|---|---|---|---|
| Violent Crime Rate | 439.7 | 312.0 | +41.0% |
| Property Crime Rate | 998.9 | 1,086.7 | -8.1% |
| Murder Rate | 7.8 | 2.0 | +294.4% |
| Total Crime Rate | 1,438.6 | 1,398.7 | +2.9% |
Lawrence Crime Rate Trends
Year-over-year crime rate changes for Lawrence, Massachusetts.
| Year | Coverage | Total Crime Rate | Violent Crime Rate | Property Crime Rate |
|---|---|---|---|---|
| 2024 | 89,600 | 1,438.6 | 439.7 | 998.9 |
| 2023 | 87,806 | 1,545.5 | 479.5 | 1,066.0 |
| 2022 | 88,422 | 1,405.8 | 502.1 | 903.6 |
| 2021 | 81,021 | 1,493.4 | 445.6 | 1,047.9 |
| 2020 | 79,997 | 1,257.6 | 448.8 | 808.8 |
| 2019 | 80,243 | 1,863.1 | 674.2 | 1,188.9 |
Frequently Asked Questions
Is Lawrence, Massachusetts safe?
Lawrence has a safety score of 59/100, meaning it has less crime than about 59% of US cities in our FBI dataset. With a total crime rate of 1,438.6 per 100,000 residents in 2024, Lawrence is about average for a US city.
What is the crime rate in Lawrence, Massachusetts?
According to FBI data for 2024, Lawrence has a violent crime rate of 439.7 per 100,000 and a property crime rate of 998.9 per 100,000 residents.
How does Lawrence compare to the national average?
Lawrence's total crime rate of 1,438.6 per 100,000 can be compared to the national average. The data covers 89,600 residents.
What types of crime are most common in Lawrence?
Based on FBI 2024 data, the most reported crimes in Lawrence include larceny-theft, aggravated assault, and burglary. Property crime is generally more common than violent crime.
Is Lawrence safe to visit?
Like any city, Lawrence has areas that are safer than others. The city's overall safety score is 59/100 based on FBI crime data. Standard travel precautions are recommended.