 Violent
Property
Total
Violent
Property
Total
Quick answer
According to crimebycity.com's analysis of FBI 2024 crime data, Norfolk, MA has a Safety Score of 94/100 — safer than 94% of US cities — with a total crime rate of 431.3 per 100,000 residents, ranking #168 of 2,971 US cities and #35 of 186 in Massachusetts.
Safety Score
Violent Crime Rate
Property Crime Rate
Is Norfolk, Massachusetts Safe?
Norfolk, Massachusetts, a small town in southeastern Massachusetts, is primarily residential with a median age of around 40. It was once home to the Norfolk County Agricultural School, reflecting its rural past.
Norfolk has a safety score of 94/100 (Safer Than Average). Based on FBI data for 2024, the city reported a total crime rate of 431.3 per 100,000 residents, compared to the national average of 2,752.3 per 100,000.
Norfolk ranks #35 out of 186 cities in Massachusetts and #168 out of 2971 nationally (safest first). This places it in the 94th percentile for safety — safer than 94% of US cities.
All major crime categories in Norfolk are below the national average, with murder particularly low at 0.0x the national rate.
Year over year, Norfolk's total crime rate increased by 47.4%, with violent crime rising 17.9%.
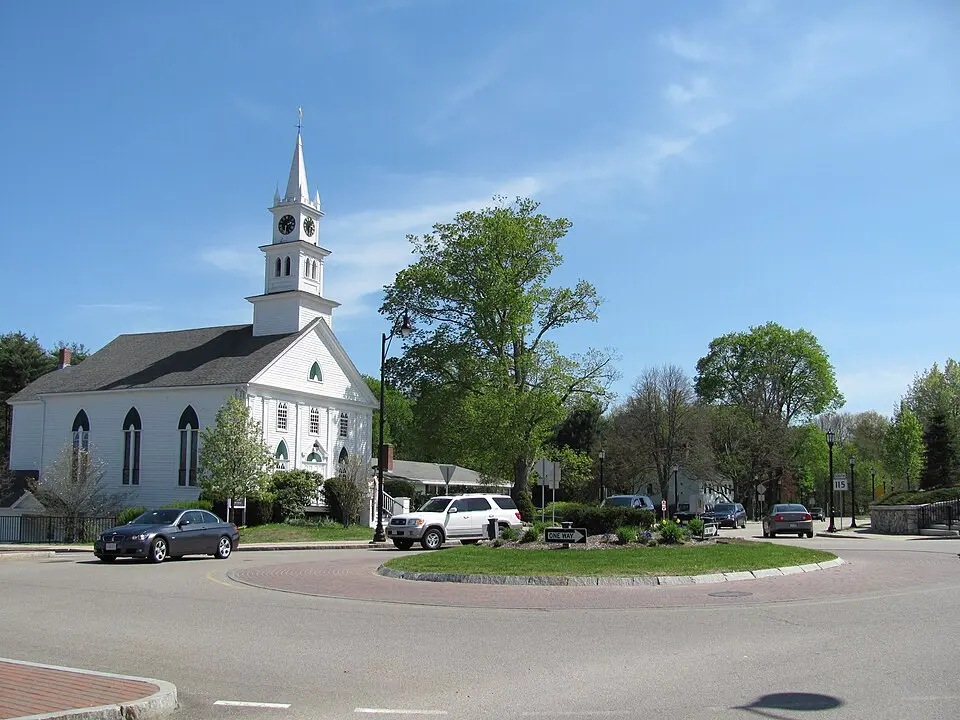
Photo: Wikimedia Commons
Norfolk Crime Statistics Breakdown (2024)
| Crime Type | Incidents | Rate per 100K | National Avg |
|---|---|---|---|
| Violent Crime | 6 | 50.7 | 473.3 |
| Murder | 0 | 0.0 | 6.2 |
| Rape | 0 | 0.0 | 43.4 |
| Robbery | 0 | 0.0 | 93.0 |
| Aggravated Assault | 6 | 50.7 | 330.0 |
| Property Crime | 45 | 380.6 | 2,279.1 |
| Burglary | 18 | 152.2 | 287.8 |
| Larceny-Theft | 23 | 194.5 | 1,638.9 |
| Motor Vehicle Theft | 4 | 33.8 | 352.4 |
| Arson | 0 | 0.0 | 0.0 |
Norfolk vs Massachusetts Average
How does Norfolk's crime rate compare to the Massachusetts state average?
| Metric | Norfolk | Massachusetts Avg | Difference |
|---|---|---|---|
| Violent Crime Rate | 50.7 | 312.0 | -83.7% |
| Property Crime Rate | 380.6 | 1,086.7 | -65.0% |
| Murder Rate | 0.0 | 2.0 | -100.0% |
| Total Crime Rate | 431.3 | 1,398.7 | -69.2% |
Norfolk Crime Rate Trends
Year-over-year crime rate changes for Norfolk, Massachusetts.
| Year | Coverage | Total Crime Rate | Violent Crime Rate | Property Crime Rate |
|---|---|---|---|---|
| 2024 | 11,824 | 431.3 | 50.7 | 380.6 |
| 2023 | 11,620 | 292.6 | 43.0 | 249.6 |
| 2022 | 11,621 | 335.6 | 77.5 | 258.2 |
| 2021 | 12,152 | 312.7 | 32.9 | 279.8 |
| 2020 | 12,068 | 124.3 | 16.6 | 107.7 |
| 2019 | 11,992 | 200.1 | 8.3 | 191.8 |
Frequently Asked Questions
Is Norfolk, Massachusetts safe?
Norfolk has a safety score of 94/100, meaning it has less crime than about 94% of US cities in our FBI dataset. With a total crime rate of 431.3 per 100,000 residents in 2024, Norfolk is relatively safe.
What is the crime rate in Norfolk, Massachusetts?
According to FBI data for 2024, Norfolk has a violent crime rate of 50.7 per 100,000 and a property crime rate of 380.6 per 100,000 residents.
How does Norfolk compare to the national average?
Norfolk's total crime rate of 431.3 per 100,000 can be compared to the national average. The data covers 11,824 residents.
What types of crime are most common in Norfolk?
Based on FBI 2024 data, the most reported crimes in Norfolk include larceny-theft, aggravated assault, and burglary. Property crime is generally more common than violent crime.
Is Norfolk safe to visit?
Like any city, Norfolk has areas that are safer than others. The city's overall safety score is 94/100 based on FBI crime data. Standard travel precautions are recommended.