 Violent
 Property
Total
Property
Total
Quick answer
According to crimebycity.com's analysis of FBI 2024 crime data, Northampton, MA has a Safety Score of 49/100 — higher crime than 51% of US cities — with a total crime rate of 1,717.2 per 100,000 residents, ranking #1,520 of 2,971 US cities and #163 of 186 in Massachusetts.
Safety Score
Violent Crime Rate
Property Crime Rate
Is Northampton, Massachusetts Safe?
Nestled in the Pioneer Valley, Northampton, MA, a vibrant college town home to Smith College, boasts a progressive culture and a high proportion of residents with advanced degrees. Its historic downtown is a hub for independent businesses and the arts.
Northampton has a safety score of 49/100 (Higher Crime Than Average). Based on FBI data for 2024, the city reported a total crime rate of 1,717.2 per 100,000 residents, compared to the national average of 2,752.3 per 100,000.
Northampton ranks #163 out of 186 cities in Massachusetts and #1520 out of 2971 nationally (safest first). This places it in the 49th percentile for safety — with higher crime than 51% of US cities.
The most elevated crime category in Northampton is rape, at 63.1 per 100K — 1.5x the national average. Conversely, motor vehicle theft is relatively low at just 0.1x the national rate.
Year over year, Northampton's total crime rate increased by 19.3%, with violent crime rising 24.2%.
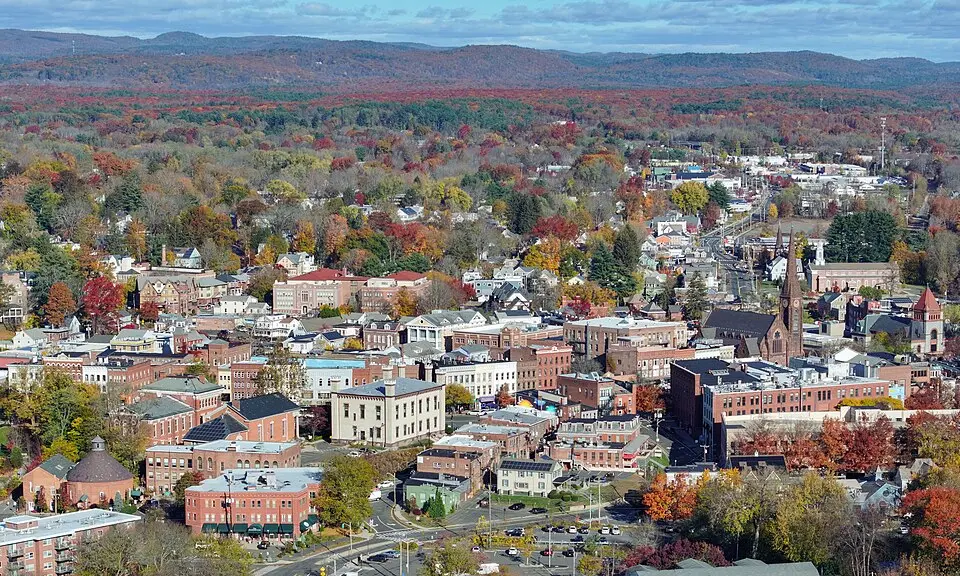
Photo: Wikimedia Commons
Northampton Crime Statistics Breakdown (2024)
| Crime Type | Incidents | Rate per 100K | National Avg |
|---|---|---|---|
| Violent Crime | 134 | 445.1 | 473.3 |
| Murder | 1 | 3.3 | 6.2 |
| Rape | 19 | 63.1 | 43.4 |
| Robbery | 4 | 13.3 | 93.0 |
| Aggravated Assault | 110 | 365.4 | 330.0 |
| Property Crime | 383 | 1,272.1 | 2,279.1 |
| Burglary | 49 | 162.8 | 287.8 |
| Larceny-Theft | 322 | 1,069.5 | 1,638.9 |
| Motor Vehicle Theft | 12 | 39.9 | 352.4 |
| Arson | 0 | 0.0 | 0.0 |
Northampton vs Massachusetts Average
How does Northampton's crime rate compare to the Massachusetts state average?
| Metric | Northampton | Massachusetts Avg | Difference |
|---|---|---|---|
| Violent Crime Rate | 445.1 | 312.0 | +42.7% |
| Property Crime Rate | 1,272.1 | 1,086.7 | +17.1% |
| Murder Rate | 3.3 | 2.0 | +67.7% |
| Total Crime Rate | 1,717.2 | 1,398.7 | +22.8% |
Northampton Crime Rate Trends
Year-over-year crime rate changes for Northampton, Massachusetts.
| Year | Coverage | Total Crime Rate | Violent Crime Rate | Property Crime Rate |
|---|---|---|---|---|
| 2024 | 30,108 | 1,717.2 | 445.1 | 1,272.1 |
| 2023 | 30,422 | 1,439.8 | 358.3 | 1,081.5 |
| 2022 | 29,150 | 1,632.9 | 380.8 | 1,252.1 |
| 2021 | 28,332 | 1,786.0 | 402.4 | 1,383.6 |
| 2020 | 28,428 | 1,969.9 | 323.6 | 1,646.3 |
| 2019 | 28,735 | 1,973.2 | 414.1 | 1,559.1 |
Frequently Asked Questions
Is Northampton, Massachusetts safe?
Northampton has a safety score of 49/100, meaning it has less crime than about 49% of US cities in our FBI dataset. With a total crime rate of 1,717.2 per 100,000 residents in 2024, Northampton is higher-crime than most US cities.
What is the crime rate in Northampton, Massachusetts?
According to FBI data for 2024, Northampton has a violent crime rate of 445.1 per 100,000 and a property crime rate of 1,272.1 per 100,000 residents.
How does Northampton compare to the national average?
Northampton's total crime rate of 1,717.2 per 100,000 can be compared to the national average. The data covers 30,108 residents.
What types of crime are most common in Northampton?
Based on FBI 2024 data, the most reported crimes in Northampton include larceny-theft, aggravated assault, and burglary. Property crime is generally more common than violent crime.
Is Northampton safe to visit?
Like any city, Northampton has areas that are safer than others. The city's overall safety score is 49/100 based on FBI crime data. Standard travel precautions are recommended.