 Violent
Property
Total
Violent
Property
Total
Quick answer
According to crimebycity.com's analysis of FBI 2024 crime data, Watertown, MA has a Safety Score of 40/100 — higher crime than 60% of US cities — with a total crime rate of 2,012.0 per 100,000 residents, ranking #1,786 of 2,971 US cities and #174 of 186 in Massachusetts.
Safety Score
Violent Crime Rate
Property Crime Rate
Is Watertown, Massachusetts Safe?
Watertown, a historic Middlesex County town, sits along the Charles River just west of Boston. It was home to the Perkins School for the Blind, where Helen Keller studied. The town has a diverse population, including a notable Armenian community.
Watertown has a safety score of 40/100 (Higher Crime Than Average). Based on FBI data for 2024, the city reported a total crime rate of 2,012.0 per 100,000 residents, compared to the national average of 2,752.3 per 100,000.
Watertown ranks #174 out of 186 cities in Massachusetts and #1786 out of 2971 nationally (safest first). This places it in the 40th percentile for safety — with higher crime than 60% of US cities.
Year over year, Watertown's total crime rate increased by 38.3%, with violent crime rising 11.7%.
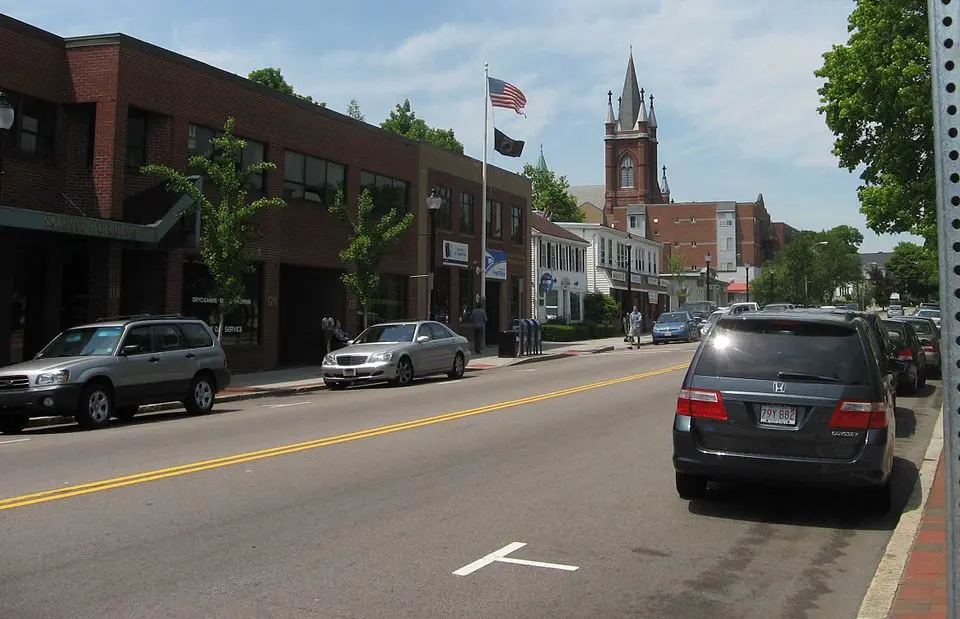
Photo: Wikimedia Commons
Watertown Crime Statistics Breakdown (2024)
| Crime Type | Incidents | Rate per 100K | National Avg |
|---|---|---|---|
| Violent Crime | 55 | 153.3 | 473.3 |
| Murder | 0 | 0.0 | 6.2 |
| Rape | 9 | 25.1 | 43.4 |
| Robbery | 3 | 8.4 | 93.0 |
| Aggravated Assault | 43 | 119.8 | 330.0 |
| Property Crime | 667 | 1,858.7 | 2,279.1 |
| Burglary | 19 | 53.0 | 287.8 |
| Larceny-Theft | 639 | 1,780.7 | 1,638.9 |
| Motor Vehicle Theft | 9 | 25.1 | 352.4 |
| Arson | 0 | 0.0 | 0.0 |
Watertown vs Massachusetts Average
How does Watertown's crime rate compare to the Massachusetts state average?
| Metric | Watertown | Massachusetts Avg | Difference |
|---|---|---|---|
| Violent Crime Rate | 153.3 | 312.0 | -50.9% |
| Property Crime Rate | 1,858.7 | 1,086.7 | +71.0% |
| Murder Rate | 0.0 | 2.0 | -100.0% |
| Total Crime Rate | 2,012.0 | 1,398.7 | +43.8% |
Watertown Crime Rate Trends
Year-over-year crime rate changes for Watertown, Massachusetts.
| Year | Coverage | Total Crime Rate | Violent Crime Rate | Property Crime Rate |
|---|---|---|---|---|
| 2024 | 35,885 | 2,012.0 | 153.3 | 1,858.7 |
| 2023 | 34,988 | 1,454.8 | 137.2 | 1,317.6 |
| 2022 | 35,088 | 1,171.3 | 139.7 | 1,031.7 |
| 2021 | 36,858 | 827.5 | 108.5 | 719.0 |
| 2020 | 36,201 | 795.6 | 85.6 | 709.9 |
| 2019 | 36,189 | 961.6 | 80.1 | 881.5 |
Frequently Asked Questions
Is Watertown, Massachusetts safe?
Watertown has a safety score of 40/100, meaning it has less crime than about 40% of US cities in our FBI dataset. With a total crime rate of 2,012.0 per 100,000 residents in 2024, Watertown is higher-crime than most US cities.
What is the crime rate in Watertown, Massachusetts?
According to FBI data for 2024, Watertown has a violent crime rate of 153.3 per 100,000 and a property crime rate of 1,858.7 per 100,000 residents.
How does Watertown compare to the national average?
Watertown's total crime rate of 2,012.0 per 100,000 can be compared to the national average. The data covers 35,885 residents.
What types of crime are most common in Watertown?
Based on FBI 2024 data, the most reported crimes in Watertown include larceny-theft, aggravated assault, and burglary. Property crime is generally more common than violent crime.
Is Watertown safe to visit?
Like any city, Watertown has areas that are safer than others. The city's overall safety score is 40/100 based on FBI crime data. Standard travel precautions are recommended.