 Violent
 Property
Total
Property
Total
Quick answer
According to crimebycity.com's analysis of FBI 2024 crime data, Hopkins, MN has a Safety Score of 53/100 — safer than 53% of US cities — with a total crime rate of 1,582.3 per 100,000 residents, ranking #1,385 of 2,971 US cities and #50 of 90 in Minnesota.
Safety Score
Violent Crime Rate
Property Crime Rate
Is Hopkins, Minnesota Safe?
Hopkins, Minnesota, a first-ring suburb west of Minneapolis, boasts a rich history, once home to the Raspberry Festival. Its population of around 19,000 residents reflects a diverse mix of ages and backgrounds.
Hopkins has a safety score of 53/100 (Near National Average). Based on FBI data for 2024, the city reported a total crime rate of 1,582.3 per 100,000 residents, compared to the national average of 2,752.3 per 100,000.
Hopkins ranks #50 out of 90 cities in Minnesota and #1385 out of 2971 nationally (safest first). This places it in the 53rd percentile for safety — safer than 53% of US cities.
Year over year, Hopkins's total crime rate decreased by 26%, with violent crime rising 9.4%.
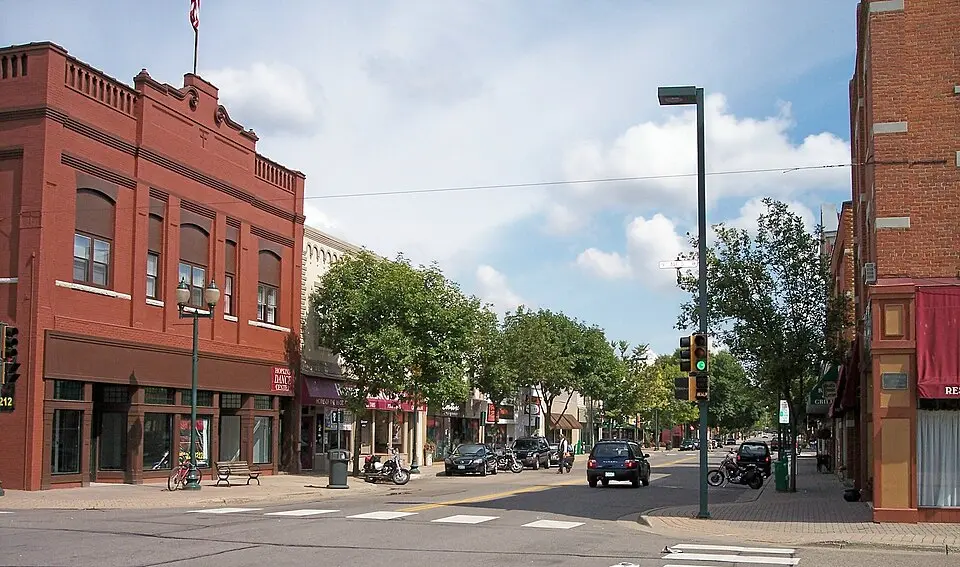
Photo: Wikimedia Commons
Hopkins Crime Statistics Breakdown (2024)
| Crime Type | Incidents | Rate per 100K | National Avg |
|---|---|---|---|
| Violent Crime | 53 | 287.2 | 473.3 |
| Murder | 0 | 0.0 | 6.2 |
| Rape | 9 | 48.8 | 43.4 |
| Robbery | 11 | 59.6 | 93.0 |
| Aggravated Assault | 32 | 173.4 | 330.0 |
| Property Crime | 239 | 1,295.1 | 2,279.1 |
| Burglary | 37 | 200.5 | 287.8 |
| Larceny-Theft | 168 | 910.4 | 1,638.9 |
| Motor Vehicle Theft | 34 | 184.2 | 352.4 |
| Arson | 0 | 0.0 | 0.0 |
Hopkins vs Minnesota Average
How does Hopkins's crime rate compare to the Minnesota state average?
| Metric | Hopkins | Minnesota Avg | Difference |
|---|---|---|---|
| Violent Crime Rate | 287.2 | 341.7 | -15.9% |
| Property Crime Rate | 1,295.1 | 2,199.4 | -41.1% |
| Murder Rate | 0.0 | 4.5 | -100.0% |
| Total Crime Rate | 1,582.3 | 2,541.1 | -37.7% |
Hopkins Crime Rate Trends
Year-over-year crime rate changes for Hopkins, Minnesota.
| Year | Coverage | Total Crime Rate | Violent Crime Rate | Property Crime Rate |
|---|---|---|---|---|
| 2024 | 18,454 | 1,582.3 | 287.2 | 1,295.1 |
| 2023 | 17,911 | 2,138.4 | 262.4 | 1,875.9 |
| 2022 | 18,125 | 2,532.4 | 209.7 | 2,322.8 |
| 2021 | 18,272 | 2,938.9 | 284.6 | 2,654.3 |
| 2020 | 18,568 | 2,639.0 | 215.4 | 2,423.5 |
| 2019 | 18,735 | 1,734.7 | 176.1 | 1,558.6 |
Frequently Asked Questions
Is Hopkins, Minnesota safe?
Hopkins has a safety score of 53/100, meaning it has less crime than about 53% of US cities in our FBI dataset. With a total crime rate of 1,582.3 per 100,000 residents in 2024, Hopkins is about average for a US city.
What is the crime rate in Hopkins, Minnesota?
According to FBI data for 2024, Hopkins has a violent crime rate of 287.2 per 100,000 and a property crime rate of 1,295.1 per 100,000 residents.
How does Hopkins compare to the national average?
Hopkins's total crime rate of 1,582.3 per 100,000 can be compared to the national average. The data covers 18,454 residents.
What types of crime are most common in Hopkins?
Based on FBI 2024 data, the most reported crimes in Hopkins include larceny-theft, aggravated assault, and burglary. Property crime is generally more common than violent crime.
Is Hopkins safe to visit?
Like any city, Hopkins has areas that are safer than others. The city's overall safety score is 53/100 based on FBI crime data. Standard travel precautions are recommended.