 Violent
 Property
Total
Property
Total
Quick answer
According to crimebycity.com's analysis of FBI 2024 crime data, Billings, MT has a Safety Score of 10/100 — higher crime than 90% of US cities — with a total crime rate of 3,832.0 per 100,000 residents, ranking #2,685 of 2,971 US cities and #5 of 7 in Montana.
Safety Score
Violent Crime Rate
Property Crime Rate
Is Billings, Montana Safe?
Billings, Montana's largest city, sits on the Yellowstone River, a hub for the region's agricultural and energy industries. Founded as a railroad town, its history is deeply tied to westward expansion. The city is a growing metropolitan area with a diverse economy.
Billings has a safety score of 10/100 (High Crime). Based on FBI data for 2024, the city reported a total crime rate of 3,832.0 per 100,000 residents, compared to the national average of 2,752.3 per 100,000.
Billings ranks #5 out of 7 cities in Montana and #2685 out of 2971 nationally (safest first). This places it in the 10th percentile for safety — with higher crime than 90% of US cities.
The most elevated crime category in Billings is rape, at 78.6 per 100K — 1.8x the national average.
Year over year, Billings's total crime rate decreased by 14.6%, with violent crime declining 15.7%.
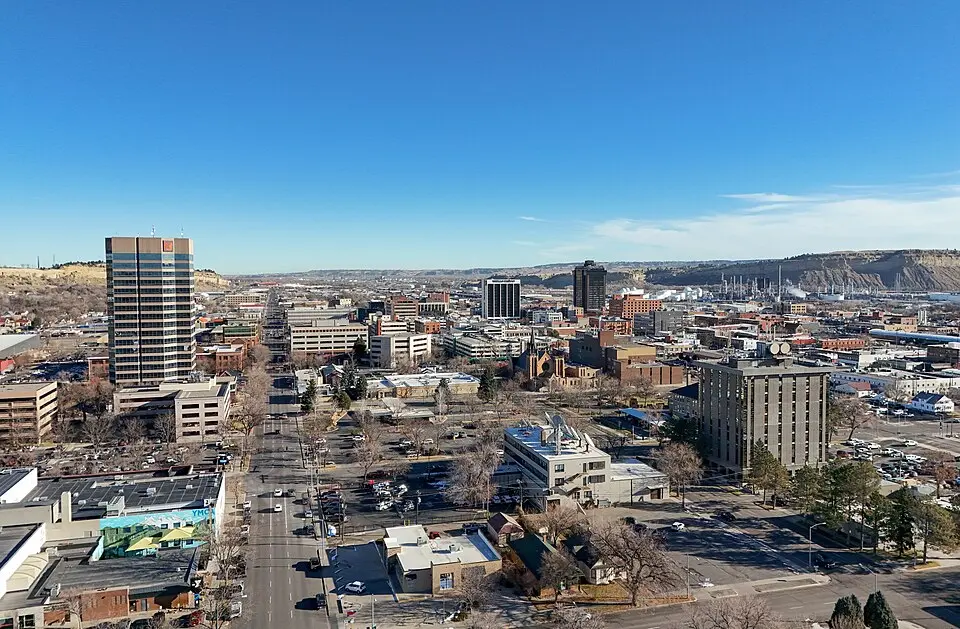
Photo: Wikimedia Commons
Billings Crime Statistics Breakdown (2024)
| Crime Type | Incidents | Rate per 100K | National Avg |
|---|---|---|---|
| Violent Crime | 914 | 748.5 | 473.3 |
| Murder | 9 | 7.4 | 6.2 |
| Rape | 96 | 78.6 | 43.4 |
| Robbery | 105 | 86.0 | 93.0 |
| Aggravated Assault | 701 | 574.1 | 330.0 |
| Property Crime | 3,765 | 3,083.4 | 2,279.1 |
| Burglary | 445 | 364.4 | 287.8 |
| Larceny-Theft | 2,808 | 2,299.7 | 1,638.9 |
| Motor Vehicle Theft | 512 | 419.3 | 352.4 |
| Arson | 0 | 0.0 | 0.0 |
Billings vs Montana Average
How does Billings's crime rate compare to the Montana state average?
| Metric | Billings | Montana Avg | Difference |
|---|---|---|---|
| Violent Crime Rate | 748.5 | 576.6 | +29.8% |
| Property Crime Rate | 3,083.4 | 2,872.9 | +7.3% |
| Murder Rate | 7.4 | 3.3 | +126.8% |
| Total Crime Rate | 3,832.0 | 3,449.5 | +11.1% |
Billings Crime Rate Trends
Year-over-year crime rate changes for Billings, Montana.
| Year | Coverage | Total Crime Rate | Violent Crime Rate | Property Crime Rate |
|---|---|---|---|---|
| 2024 | 122,105 | 3,832.0 | 748.5 | 3,083.4 |
| 2023 | 121,365 | 4,487.3 | 888.2 | 3,599.1 |
| 2022 | 117,866 | 5,276.3 | 941.8 | 4,334.6 |
| 2021 | 110,274 | 5,891.7 | 1,082.8 | 4,808.9 |
| 2020 | 110,157 | 5,683.7 | 877.8 | 4,805.9 |
| 2019 | 110,198 | 4,695.2 | 612.5 | 4,082.7 |
Frequently Asked Questions
Is Billings, Montana safe?
Billings has a safety score of 10/100, meaning it has less crime than about 10% of US cities in our FBI dataset. With a total crime rate of 3,832.0 per 100,000 residents in 2024, Billings is among the highest-crime US cities.
What is the crime rate in Billings, Montana?
According to FBI data for 2024, Billings has a violent crime rate of 748.5 per 100,000 and a property crime rate of 3,083.4 per 100,000 residents.
How does Billings compare to the national average?
Billings's total crime rate of 3,832.0 per 100,000 can be compared to the national average. The data covers 122,105 residents.
What types of crime are most common in Billings?
Based on FBI 2024 data, the most reported crimes in Billings include larceny-theft, aggravated assault, and burglary. Property crime is generally more common than violent crime.
Is Billings safe to visit?
Like any city, Billings has areas that are safer than others. The city's overall safety score is 10/100 based on FBI crime data. Standard travel precautions are recommended.