 Violent
 Property
Total
Property
Total
Quick answer
According to crimebycity.com's analysis of FBI 2024 crime data, Great Falls, MT has a Safety Score of 8/100 — higher crime than 91% of US cities — with a total crime rate of 4,000.7 per 100,000 residents, ranking #2,719 of 2,971 US cities and #6 of 7 in Montana.
Safety Score
Violent Crime Rate
Property Crime Rate
Is Great Falls, Montana Safe?
Great Falls, Montana, a city bisected by the Missouri River, holds the only remaining intact Black Eagle Dam, a marvel of early hydroelectric engineering. This community, the third largest in Montana, is known for its proximity to Malmstrom Air Force Base.
Great Falls has a safety score of 8/100 (High Crime). Based on FBI data for 2024, the city reported a total crime rate of 4,000.7 per 100,000 residents, compared to the national average of 2,752.3 per 100,000.
Great Falls ranks #6 out of 7 cities in Montana and #2719 out of 2971 nationally (safest first). This places it in the 9th percentile for safety — with higher crime than 91% of US cities.
The most elevated crime category in Great Falls is rape, at 89.4 per 100K — 2.1x the national average. Conversely, murder is relatively low at just 0.0x the national rate.
Year over year, Great Falls's total crime rate decreased by 23.7%, with violent crime rising 1.4%.
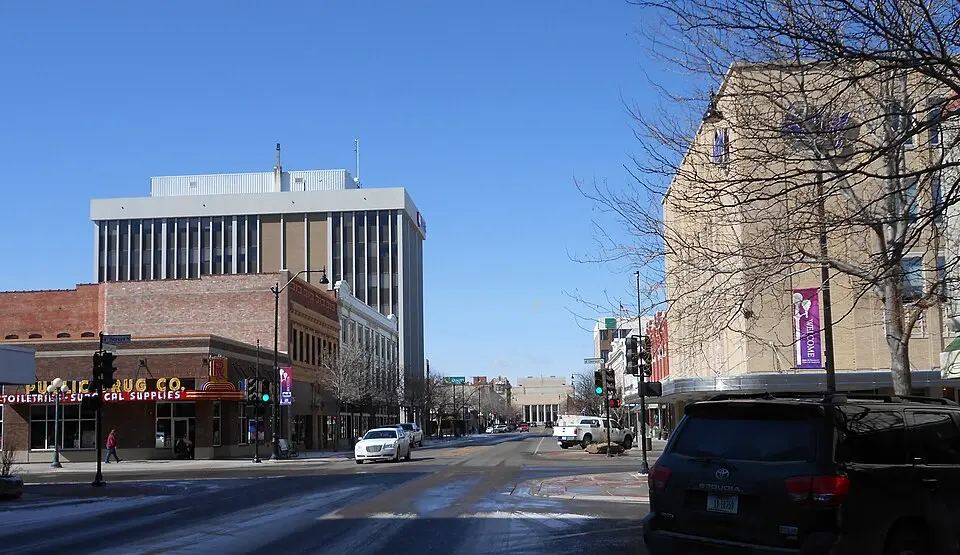
Photo: Wikimedia Commons
Great Falls Crime Statistics Breakdown (2024)
| Crime Type | Incidents | Rate per 100K | National Avg |
|---|---|---|---|
| Violent Crime | 347 | 574.4 | 473.3 |
| Murder | 0 | 0.0 | 6.2 |
| Rape | 54 | 89.4 | 43.4 |
| Robbery | 28 | 46.4 | 93.0 |
| Aggravated Assault | 265 | 438.6 | 330.0 |
| Property Crime | 2,070 | 3,426.4 | 2,279.1 |
| Burglary | 240 | 397.3 | 287.8 |
| Larceny-Theft | 1,698 | 2,810.6 | 1,638.9 |
| Motor Vehicle Theft | 132 | 218.5 | 352.4 |
| Arson | 0 | 0.0 | 0.0 |
Great Falls vs Montana Average
How does Great Falls's crime rate compare to the Montana state average?
| Metric | Great Falls | Montana Avg | Difference |
|---|---|---|---|
| Violent Crime Rate | 574.4 | 576.6 | -0.4% |
| Property Crime Rate | 3,426.4 | 2,872.9 | +19.3% |
| Murder Rate | 0.0 | 3.3 | -100.0% |
| Total Crime Rate | 4,000.7 | 3,449.5 | +16.0% |
Great Falls Crime Rate Trends
Year-over-year crime rate changes for Great Falls, Montana.
| Year | Coverage | Total Crime Rate | Violent Crime Rate | Property Crime Rate |
|---|---|---|---|---|
| 2024 | 60,414 | 4,000.7 | 574.4 | 3,426.4 |
| 2023 | 60,358 | 5,242.1 | 566.6 | 4,675.4 |
| 2022 | 60,386 | 4,982.9 | 498.5 | 4,484.5 |
| 2021 | 58,265 | 5,324.0 | 559.5 | 4,764.4 |
| 2020 | 58,345 | 5,662.9 | 476.5 | 5,186.4 |
| 2019 | 58,637 | 6,322.0 | 515.0 | 5,806.9 |
Frequently Asked Questions
Is Great Falls, Montana safe?
Great Falls has a safety score of 8/100, meaning it has less crime than about 8% of US cities in our FBI dataset. With a total crime rate of 4,000.7 per 100,000 residents in 2024, Great Falls is among the highest-crime US cities.
What is the crime rate in Great Falls, Montana?
According to FBI data for 2024, Great Falls has a violent crime rate of 574.4 per 100,000 and a property crime rate of 3,426.4 per 100,000 residents.
How does Great Falls compare to the national average?
Great Falls's total crime rate of 4,000.7 per 100,000 can be compared to the national average. The data covers 60,414 residents.
What types of crime are most common in Great Falls?
Based on FBI 2024 data, the most reported crimes in Great Falls include larceny-theft, aggravated assault, and burglary. Property crime is generally more common than violent crime.
Is Great Falls safe to visit?
Like any city, Great Falls has areas that are safer than others. The city's overall safety score is 8/100 based on FBI crime data. Standard travel precautions are recommended.