 Violent
 Property
 Total
Total
Quick answer
According to crimebycity.com's analysis of FBI 2024 crime data, Grand Forks, ND has a Safety Score of 25/100 — higher crime than 74% of US cities — with a total crime rate of 2,640.7 per 100,000 residents, ranking #2,214 of 2,971 US cities and #5 of 9 in North Dakota.
Safety Score
Violent Crime Rate
Property Crime Rate
Is Grand Forks, North Dakota Safe?
Grand Forks, a city on the Red River, is home to the University of North Dakota. Its economy is influenced by agriculture and the nearby Grand Forks Air Force Base, reflecting its position in the flat, fertile Red River Valley.
Grand Forks has a safety score of 25/100 (High Crime). Based on FBI data for 2024, the city reported a total crime rate of 2,640.7 per 100,000 residents, compared to the national average of 2,752.3 per 100,000.
Grand Forks ranks #5 out of 9 cities in North Dakota and #2214 out of 2971 nationally (safest first). This places it in the 26th percentile for safety — with higher crime than 74% of US cities.
The most elevated crime category in Grand Forks is rape, at 73.1 per 100K — 1.7x the national average. Conversely, robbery is relatively low at just 0.3x the national rate.
Year over year, Grand Forks's total crime rate decreased by 6.1%, with violent crime rising 36.1%.
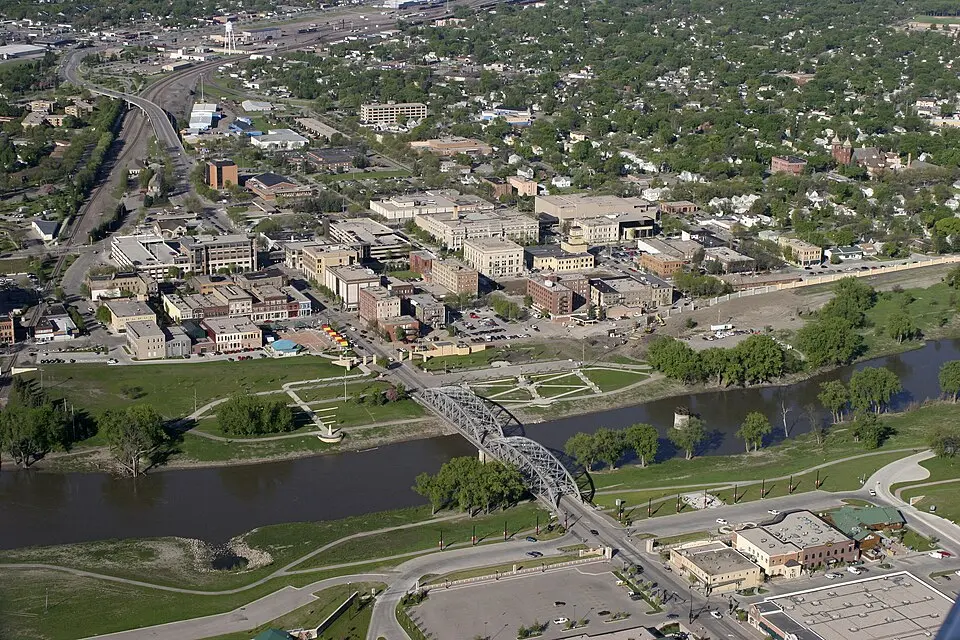
Photo: Wikimedia Commons
Grand Forks Crime Statistics Breakdown (2024)
| Crime Type | Incidents | Rate per 100K | National Avg |
|---|---|---|---|
| Violent Crime | 211 | 358.6 | 473.3 |
| Murder | 3 | 5.1 | 6.2 |
| Rape | 43 | 73.1 | 43.4 |
| Robbery | 16 | 27.2 | 93.0 |
| Aggravated Assault | 149 | 253.2 | 330.0 |
| Property Crime | 1,343 | 2,282.2 | 2,279.1 |
| Burglary | 151 | 256.6 | 287.8 |
| Larceny-Theft | 1,103 | 1,874.3 | 1,638.9 |
| Motor Vehicle Theft | 89 | 151.2 | 352.4 |
| Arson | 0 | 0.0 | 0.0 |
Grand Forks vs North Dakota Average
How does Grand Forks's crime rate compare to the North Dakota state average?
| Metric | Grand Forks | North Dakota Avg | Difference |
|---|---|---|---|
| Violent Crime Rate | 358.6 | 354.0 | +1.3% |
| Property Crime Rate | 2,282.2 | 2,471.4 | -7.7% |
| Murder Rate | 5.1 | 3.1 | +64.0% |
| Total Crime Rate | 2,640.7 | 2,825.4 | -6.5% |
Grand Forks Crime Rate Trends
Year-over-year crime rate changes for Grand Forks, North Dakota.
| Year | Coverage | Total Crime Rate | Violent Crime Rate | Property Crime Rate |
|---|---|---|---|---|
| 2024 | 58,848 | 2,640.7 | 358.6 | 2,282.2 |
| 2023 | 58,470 | 2,813.4 | 263.4 | 2,550.0 |
| 2022 | 58,620 | 3,299.2 | 296.8 | 3,002.4 |
| 2021 | 56,253 | 2,853.2 | 311.1 | 2,542.1 |
| 2020 | 56,163 | 2,647.7 | 292.0 | 2,355.6 |
| 2019 | 57,459 | 2,763.7 | 288.9 | 2,474.8 |
Frequently Asked Questions
Is Grand Forks, North Dakota safe?
Grand Forks has a safety score of 25/100, meaning it has less crime than about 25% of US cities in our FBI dataset. With a total crime rate of 2,640.7 per 100,000 residents in 2024, Grand Forks is among the highest-crime US cities.
What is the crime rate in Grand Forks, North Dakota?
According to FBI data for 2024, Grand Forks has a violent crime rate of 358.6 per 100,000 and a property crime rate of 2,282.2 per 100,000 residents.
How does Grand Forks compare to the national average?
Grand Forks's total crime rate of 2,640.7 per 100,000 can be compared to the national average. The data covers 58,848 residents.
What types of crime are most common in Grand Forks?
Based on FBI 2024 data, the most reported crimes in Grand Forks include larceny-theft, aggravated assault, and burglary. Property crime is generally more common than violent crime.
Is Grand Forks safe to visit?
Like any city, Grand Forks has areas that are safer than others. The city's overall safety score is 25/100 based on FBI crime data. Standard travel precautions are recommended.