Is Brentwood or Grand Forks Safer?
According to crimebycity.com's analysis of 2024 FBI data, Brentwood is safer than Grand Forks (Safety Score 26/100 vs 25/100), with a total crime rate of 2,633 per 100,000 versus 2,641 for Grand Forks — 0% lower. Brentwood has higher rates in 3 of 7 crime categories.
The biggest difference is in murder, where Brentwood has a 100% lower rate.
Brentwood — 5-Year Trend
 Violent
 Property
Total
Property
Total
Grand Forks — 5-Year Trend
Violent
 Property
Total
Property
Total
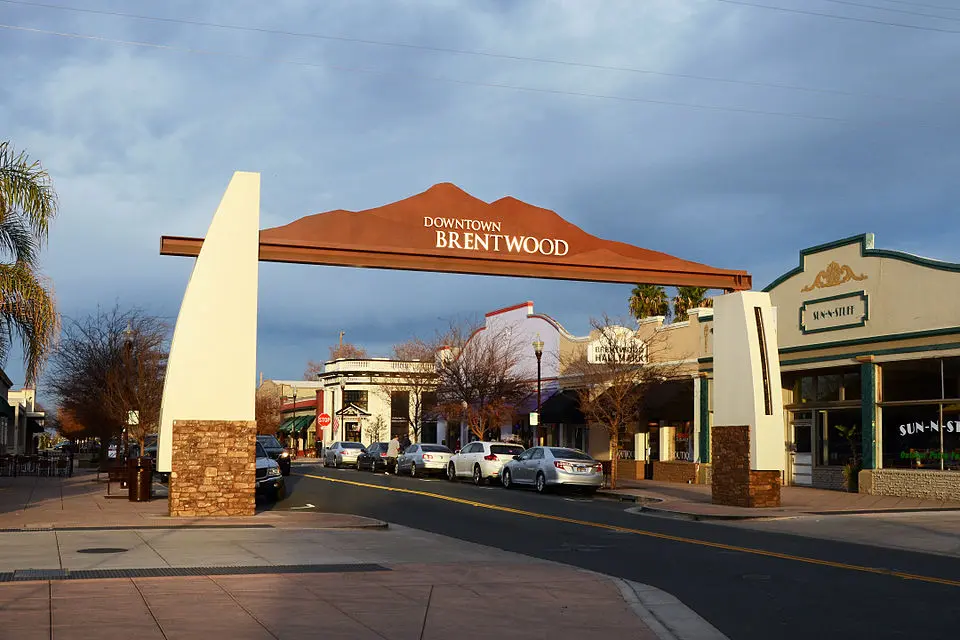
Brentwood, CA
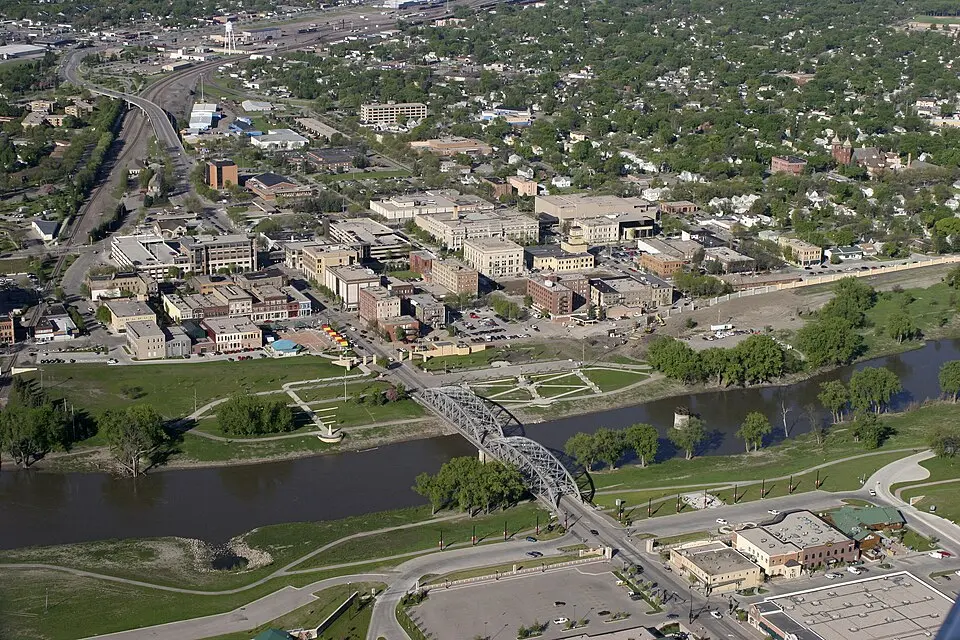
Grand Forks, ND
Detailed Crime Rate Comparison
| Crime Type | Brentwood | Grand Forks | Difference |
|---|---|---|---|
| Total Crime Rate | 2,633.4 | 2,640.7 | -7.3 |
| Violent Crime Rate | 243.3 | 358.6 | -115.3 |
| Murder Rate | 0.0 | 5.1 | -5.1 |
| Rape Rate | 30.6 | 73.1 | -42.5 |
| Robbery Rate | 90.3 | 27.2 | +63.1 |
| Aggravated Assault Rate | 120.9 | 253.2 | -132.3 |
| Property Crime Rate | 2,390.1 | 2,282.2 | +108.0 |
| Burglary Rate | 220.4 | 256.6 | -36.2 |
| Larceny-Theft Rate | 1,912.7 | 1,874.3 | +38.4 |
| Motor Vehicle Theft Rate | 257.1 | 151.2 | +105.8 |
All rates per 100,000 residents. Source: FBI UCR 2024.
Frequently Asked Questions
Is Brentwood or Grand Forks safer?
Brentwood is safer with a total crime rate of 2,633 per 100K vs 2,641 for Grand Forks — a 0% difference.
How do violent crime rates compare?
Brentwood has a violent crime rate of 243.3 per 100K while Grand Forks has 358.6. Brentwood has lower violent crime.
About Brentwood, CA
Brentwood, a Los Angeles neighborhood home to the Getty Center, stretches from the Santa Monica Mountains to the Pacific Ocean. Its affluent residents enjoy a Mediterranean climate. With a safety score of 26/100 and a population coverage of 65,352, Brentwood has a total crime rate of 2,633.4 per 100,000 residents.
About Grand Forks, ND
Grand Forks, a city on the Red River, is home to the University of North Dakota. Its economy is influenced by agriculture and the nearby Grand Forks Air Force Base, reflecting its position in the flat, fertile Red River Valley. With a safety score of 25/100 and a population coverage of 58,848, Grand Forks has a total crime rate of 2,640.7 per 100,000 residents.