 Violent
 Property
Total
Property
Total
Quick answer
According to crimebycity.com's analysis of FBI 2024 crime data, Upper Darby Township, PA has a Safety Score of 19/100 — higher crime than 81% of US cities — with a total crime rate of 3,046.0 per 100,000 residents, ranking #2,411 of 2,971 US cities and #188 of 197 in Pennsylvania.
Safety Score
Violent Crime Rate
Property Crime Rate
Is Upper Darby Township, Pennsylvania Safe?
Upper Darby Township, a diverse community bordering Philadelphia, is home to the historic Tower Theater, a renowned music venue. Its dense, suburban landscape is traversed by major arteries, and its population reflects a rich tapestry of over 100 spoken languages.
Upper Darby Township has a safety score of 19/100 (High Crime). Based on FBI data for 2024, the city reported a total crime rate of 3,046.0 per 100,000 residents, compared to the national average of 2,752.3 per 100,000.
Upper Darby Township ranks #188 out of 197 cities in Pennsylvania and #2411 out of 2971 nationally (safest first). This places it in the 19th percentile for safety — with higher crime than 81% of US cities.
The most elevated crime category in Upper Darby Township is larceny-theft, at 2,429.5 per 100K — 1.5x the national average. Conversely, rape is relatively low at just 0.2x the national rate.
Year over year, Upper Darby Township's total crime rate increased by 2.9%, with violent crime declining 17.2%.
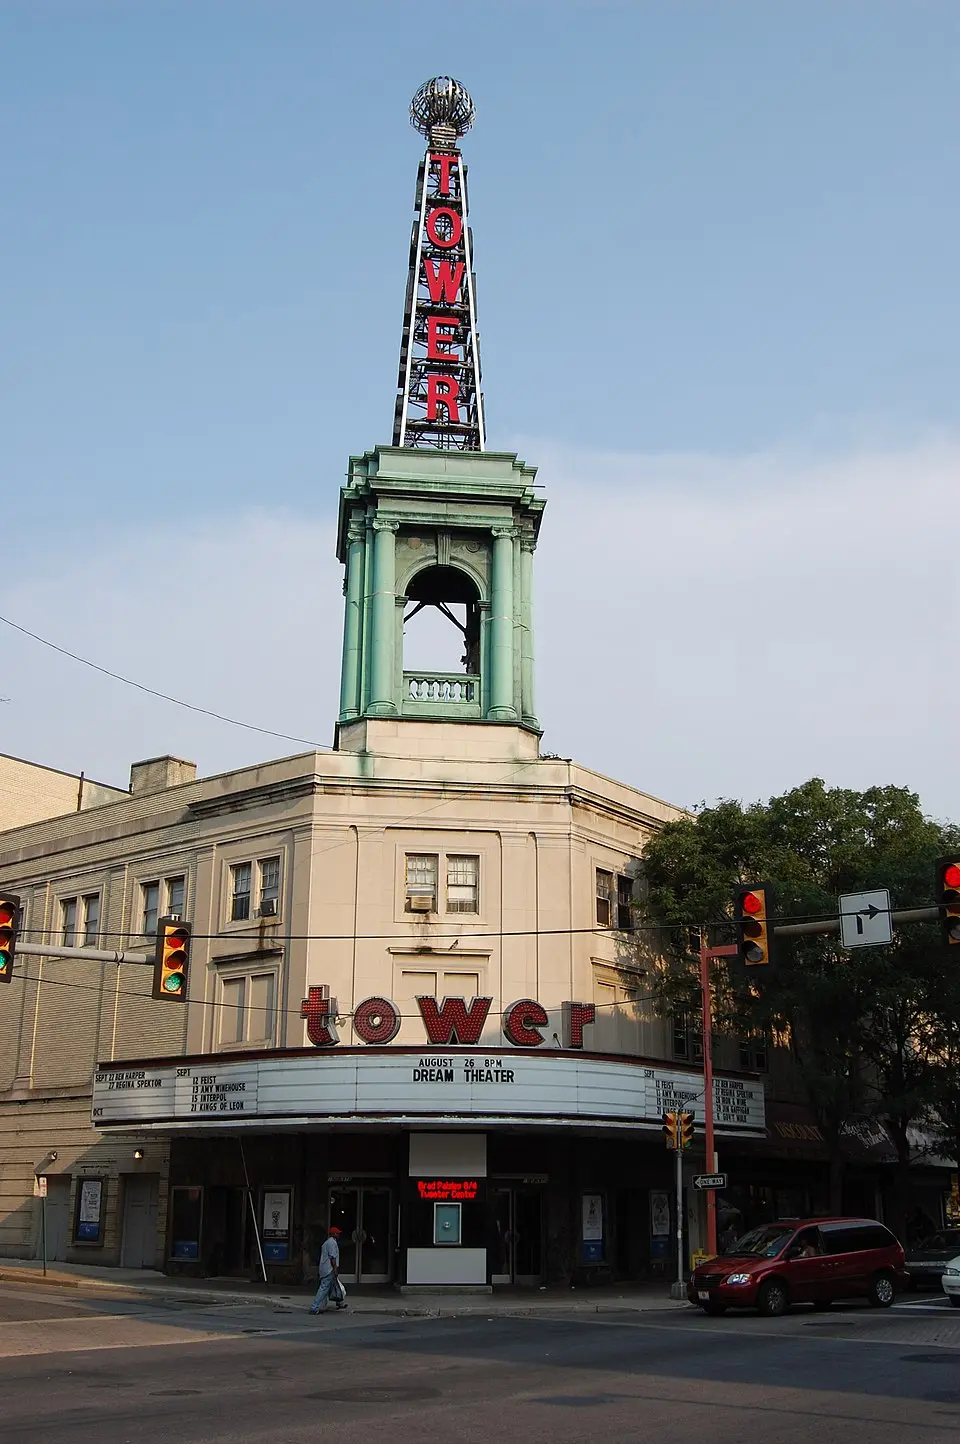
Photo: Wikimedia Commons
Upper Darby Township Crime Statistics Breakdown (2024)
| Crime Type | Incidents | Rate per 100K | National Avg |
|---|---|---|---|
| Violent Crime | 181 | 213.8 | 473.3 |
| Murder | 4 | 4.7 | 6.2 |
| Rape | 6 | 7.1 | 43.4 |
| Robbery | 113 | 133.5 | 93.0 |
| Aggravated Assault | 58 | 68.5 | 330.0 |
| Property Crime | 2,398 | 2,832.2 | 2,279.1 |
| Burglary | 55 | 65.0 | 287.8 |
| Larceny-Theft | 2,057 | 2,429.5 | 1,638.9 |
| Motor Vehicle Theft | 286 | 337.8 | 352.4 |
| Arson | 0 | 0.0 | 0.0 |
Upper Darby Township vs Pennsylvania Average
How does Upper Darby Township's crime rate compare to the Pennsylvania state average?
| Metric | Upper Darby Township | Pennsylvania Avg | Difference |
|---|---|---|---|
| Violent Crime Rate | 213.8 | 359.1 | -40.5% |
| Property Crime Rate | 2,832.2 | 2,103.7 | +34.6% |
| Murder Rate | 4.7 | 7.1 | -33.4% |
| Total Crime Rate | 3,046.0 | 2,462.7 | +23.7% |
Upper Darby Township Crime Rate Trends
Year-over-year crime rate changes for Upper Darby Township, Pennsylvania.
| Year | Coverage | Total Crime Rate | Violent Crime Rate | Property Crime Rate |
|---|---|---|---|---|
| 2024 | 84,668 | 3,046.0 | 213.8 | 2,832.2 |
| 2023 | 84,468 | 2,959.7 | 258.1 | 2,701.6 |
| 2020 | 82,947 | 1,350.3 | 191.7 | 1,158.6 |
| 2019 | 82,708 | 1,154.7 | 232.1 | 922.5 |
Frequently Asked Questions
Is Upper Darby Township, Pennsylvania safe?
Upper Darby Township has a safety score of 19/100, meaning it has less crime than about 19% of US cities in our FBI dataset. With a total crime rate of 3,046.0 per 100,000 residents in 2024, Upper Darby Township is among the highest-crime US cities.
What is the crime rate in Upper Darby Township, Pennsylvania?
According to FBI data for 2024, Upper Darby Township has a violent crime rate of 213.8 per 100,000 and a property crime rate of 2,832.2 per 100,000 residents.
How does Upper Darby Township compare to the national average?
Upper Darby Township's total crime rate of 3,046.0 per 100,000 can be compared to the national average. The data covers 84,668 residents.
What types of crime are most common in Upper Darby Township?
Based on FBI 2024 data, the most reported crimes in Upper Darby Township include larceny-theft, aggravated assault, and burglary. Property crime is generally more common than violent crime.
Is Upper Darby Township safe to visit?
Like any city, Upper Darby Township has areas that are safer than others. The city's overall safety score is 19/100 based on FBI crime data. Standard travel precautions are recommended.