 Violent
Property
Total
Violent
Property
Total
Quick answer
According to crimebycity.com's analysis of FBI 2024 crime data, Arlington, TX has a Safety Score of 21/100 — higher crime than 79% of US cities — with a total crime rate of 2,896.4 per 100,000 residents, ranking #2,343 of 2,971 US cities and #199 of 240 in Texas.
Safety Score
Violent Crime Rate
Property Crime Rate
Is Arlington, Texas Safe?
Arlington, Texas, a large city in the Dallas-Fort Worth Metroplex, is home to AT&T Stadium and Six Flags Over Texas. It is the largest city in the state without a major public transit system.
Arlington has a safety score of 21/100 (High Crime). Based on FBI data for 2024, the city reported a total crime rate of 2,896.4 per 100,000 residents, compared to the national average of 2,752.3 per 100,000.
Arlington ranks #199 out of 240 cities in Texas and #2343 out of 2971 nationally (safest first). This places it in the 21st percentile for safety — with higher crime than 79% of US cities.
The most elevated crime category in Arlington is rape, at 71.3 per 100K — 1.6x the national average. Conversely, robbery is relatively low at just 0.6x the national rate.
Year over year, Arlington's total crime rate decreased by 5.5%.
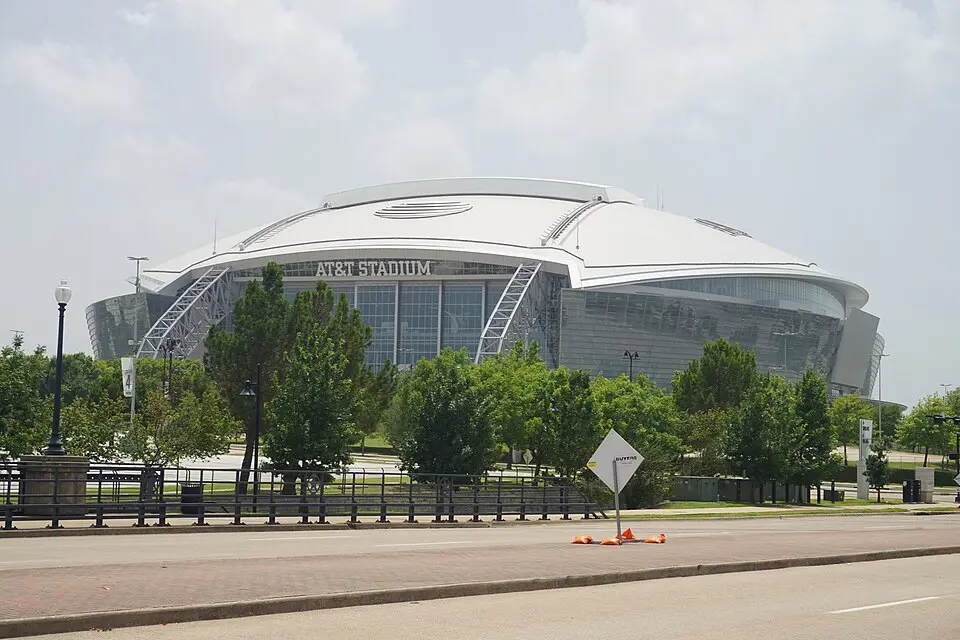
Photo: Wikimedia Commons
Arlington Crime Statistics Breakdown (2024)
| Crime Type | Incidents | Rate per 100K | National Avg |
|---|---|---|---|
| Violent Crime | 1,934 | 483.7 | 473.3 |
| Murder | 17 | 4.3 | 6.2 |
| Rape | 285 | 71.3 | 43.4 |
| Robbery | 240 | 60.0 | 93.0 |
| Aggravated Assault | 1,389 | 347.4 | 330.0 |
| Property Crime | 9,647 | 2,412.7 | 2,279.1 |
| Burglary | 1,055 | 263.9 | 287.8 |
| Larceny-Theft | 6,948 | 1,737.7 | 1,638.9 |
| Motor Vehicle Theft | 1,644 | 411.2 | 352.4 |
| Arson | 0 | 0.0 | 0.0 |
Arlington vs Texas Average
How does Arlington's crime rate compare to the Texas state average?
| Metric | Arlington | Texas Avg | Difference |
|---|---|---|---|
| Violent Crime Rate | 483.7 | 467.4 | +3.5% |
| Property Crime Rate | 2,412.7 | 2,498.3 | -3.4% |
| Murder Rate | 4.3 | 6.3 | -32.2% |
| Total Crime Rate | 2,896.4 | 2,965.7 | -2.3% |
Arlington Crime Rate Trends
Year-over-year crime rate changes for Arlington, Texas.
| Year | Coverage | Total Crime Rate | Violent Crime Rate | Property Crime Rate |
|---|---|---|---|---|
| 2024 | 399,840 | 2,896.4 | 483.7 | 2,412.7 |
| 2023 | 394,799 | 3,065.4 | 487.3 | 2,578.0 |
| 2022 | 391,591 | 3,118.3 | 585.3 | 2,533.0 |
| 2021 | 402,323 | 3,151.2 | 578.6 | 2,572.6 |
| 2020 | 402,700 | 3,118.2 | 551.0 | 2,567.2 |
| 2019 | 402,304 | 3,318.1 | 511.6 | 2,806.6 |
Frequently Asked Questions
Is Arlington, Texas safe?
Arlington has a safety score of 21/100, meaning it has less crime than about 21% of US cities in our FBI dataset. With a total crime rate of 2,896.4 per 100,000 residents in 2024, Arlington is among the highest-crime US cities.
What is the crime rate in Arlington, Texas?
According to FBI data for 2024, Arlington has a violent crime rate of 483.7 per 100,000 and a property crime rate of 2,412.7 per 100,000 residents.
How does Arlington compare to the national average?
Arlington's total crime rate of 2,896.4 per 100,000 can be compared to the national average. The data covers 399,840 residents.
What types of crime are most common in Arlington?
Based on FBI 2024 data, the most reported crimes in Arlington include larceny-theft, aggravated assault, and burglary. Property crime is generally more common than violent crime.
Is Arlington safe to visit?
Like any city, Arlington has areas that are safer than others. The city's overall safety score is 21/100 based on FBI crime data. Standard travel precautions are recommended.