 Violent
 Property
Total
Property
Total
Quick answer
According to crimebycity.com's analysis of FBI 2024 crime data, Galveston, TX has a Safety Score of 21/100 — higher crime than 79% of US cities — with a total crime rate of 2,917.1 per 100,000 residents, ranking #2,356 of 2,971 US cities and #200 of 240 in Texas.
Safety Score
Violent Crime Rate
Property Crime Rate
Is Galveston, Texas Safe?
Galveston, a barrier island city, boasts a rich history with its Strand Historic District and Victorian architecture. Its population is diverse, reflecting a mix of long-time residents and a growing tourism industry.
Galveston has a safety score of 21/100 (High Crime). Based on FBI data for 2024, the city reported a total crime rate of 2,917.1 per 100,000 residents, compared to the national average of 2,752.3 per 100,000.
Galveston ranks #200 out of 240 cities in Texas and #2356 out of 2971 nationally (safest first). This places it in the 21st percentile for safety — with higher crime than 79% of US cities.
The most elevated crime category in Galveston is rape, at 150.7 per 100K — 3.5x the national average. Conversely, motor vehicle theft is relatively low at just 0.8x the national rate.
Year over year, Galveston's total crime rate increased by 3.3%, with violent crime rising 3.8%.
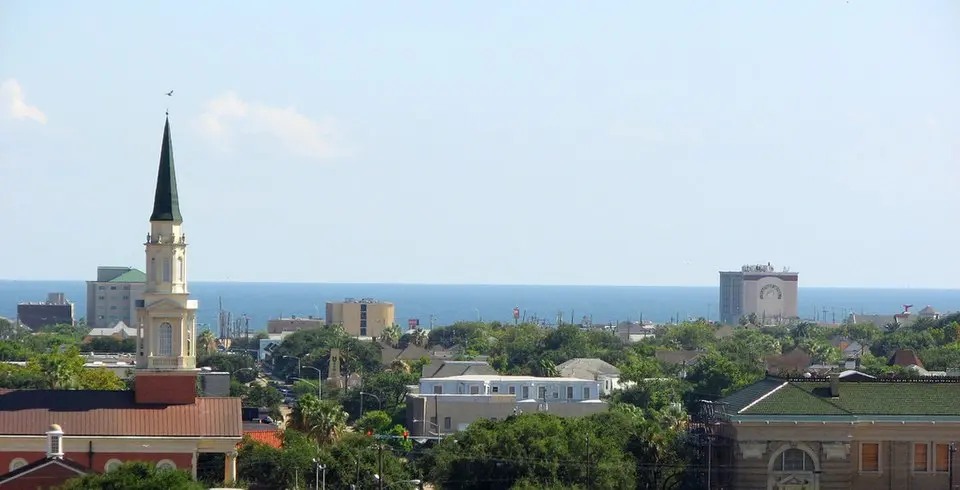
Photo: Wikimedia Commons
Galveston Crime Statistics Breakdown (2024)
| Crime Type | Incidents | Rate per 100K | National Avg |
|---|---|---|---|
| Violent Crime | 285 | 536.7 | 473.3 |
| Murder | 3 | 5.7 | 6.2 |
| Rape | 80 | 150.7 | 43.4 |
| Robbery | 57 | 107.3 | 93.0 |
| Aggravated Assault | 145 | 273.1 | 330.0 |
| Property Crime | 1,264 | 2,380.4 | 2,279.1 |
| Burglary | 139 | 261.8 | 287.8 |
| Larceny-Theft | 984 | 1,853.1 | 1,638.9 |
| Motor Vehicle Theft | 141 | 265.5 | 352.4 |
| Arson | 0 | 0.0 | 0.0 |
Galveston vs Texas Average
How does Galveston's crime rate compare to the Texas state average?
| Metric | Galveston | Texas Avg | Difference |
|---|---|---|---|
| Violent Crime Rate | 536.7 | 467.4 | +14.8% |
| Property Crime Rate | 2,380.4 | 2,498.3 | -4.7% |
| Murder Rate | 5.7 | 6.3 | -9.9% |
| Total Crime Rate | 2,917.1 | 2,965.7 | -1.6% |
Galveston Crime Rate Trends
Year-over-year crime rate changes for Galveston, Texas.
| Year | Coverage | Total Crime Rate | Violent Crime Rate | Property Crime Rate |
|---|---|---|---|---|
| 2024 | 53,100 | 2,917.1 | 536.7 | 2,380.4 |
| 2023 | 52,810 | 2,825.2 | 517.0 | 2,308.3 |
| 2022 | 52,920 | 3,418.4 | 485.6 | 2,932.7 |
| 2021 | 50,321 | 3,282.9 | 622.0 | 2,660.9 |
| 2020 | 50,751 | 3,982.2 | 658.1 | 3,324.1 |
| 2019 | 50,801 | 3,714.5 | 482.3 | 3,232.2 |
Frequently Asked Questions
Is Galveston, Texas safe?
Galveston has a safety score of 21/100, meaning it has less crime than about 21% of US cities in our FBI dataset. With a total crime rate of 2,917.1 per 100,000 residents in 2024, Galveston is among the highest-crime US cities.
What is the crime rate in Galveston, Texas?
According to FBI data for 2024, Galveston has a violent crime rate of 536.7 per 100,000 and a property crime rate of 2,380.4 per 100,000 residents.
How does Galveston compare to the national average?
Galveston's total crime rate of 2,917.1 per 100,000 can be compared to the national average. The data covers 53,100 residents.
What types of crime are most common in Galveston?
Based on FBI 2024 data, the most reported crimes in Galveston include larceny-theft, aggravated assault, and burglary. Property crime is generally more common than violent crime.
Is Galveston safe to visit?
Like any city, Galveston has areas that are safer than others. The city's overall safety score is 21/100 based on FBI crime data. Standard travel precautions are recommended.