 Violent
 Property
Total
Property
Total
Quick answer
According to crimebycity.com's analysis of FBI 2024 crime data, Irving, TX has a Safety Score of 29/100 — higher crime than 71% of US cities — with a total crime rate of 2,474.6 per 100,000 residents, ranking #2,115 of 2,971 US cities and #179 of 240 in Texas.
Safety Score
Violent Crime Rate
Property Crime Rate
Is Irving, Texas Safe?
Irving, Texas, a principal city in the Dallas–Fort Worth metroplex, is home to the Las Colinas urban development. Its diverse population reflects a blend of residential areas and significant corporate presences, including Fortune 500 companies.
Irving has a safety score of 29/100 (High Crime). Based on FBI data for 2024, the city reported a total crime rate of 2,474.6 per 100,000 residents, compared to the national average of 2,752.3 per 100,000.
Irving ranks #179 out of 240 cities in Texas and #2115 out of 2971 nationally (safest first). This places it in the 29th percentile for safety — with higher crime than 71% of US cities.
The most elevated crime category in Irving is rape, at 53.6 per 100K — 1.2x the national average. Conversely, aggravated assault is relatively low at just 0.5x the national rate.
Year over year, Irving's total crime rate decreased by 10.1%, with violent crime declining 9.2%.
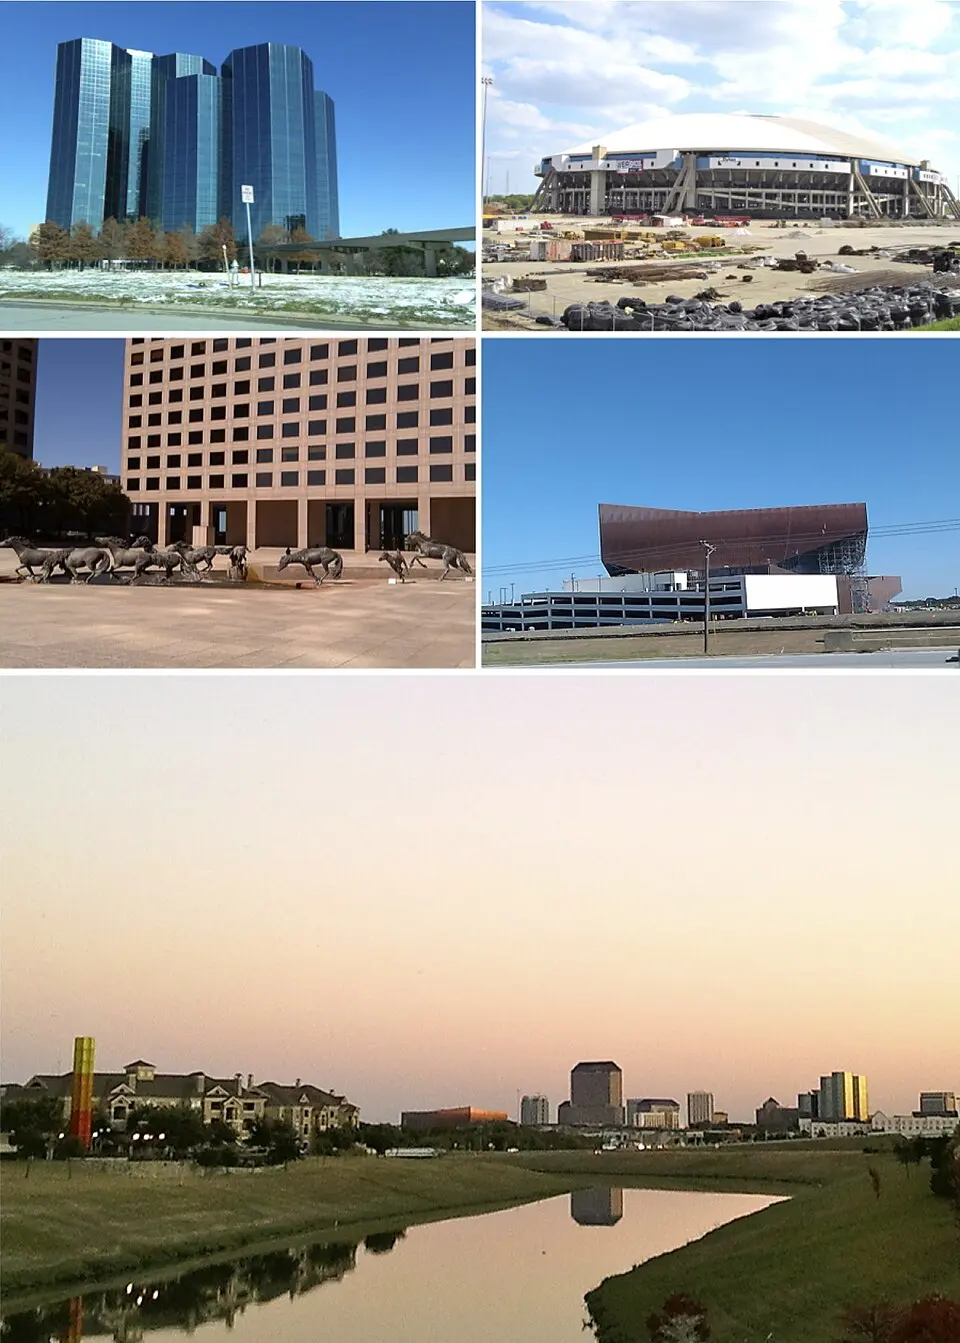
Photo: Wikimedia Commons
Irving Crime Statistics Breakdown (2024)
| Crime Type | Incidents | Rate per 100K | National Avg |
|---|---|---|---|
| Violent Crime | 710 | 275.8 | 473.3 |
| Murder | 19 | 7.4 | 6.2 |
| Rape | 138 | 53.6 | 43.4 |
| Robbery | 147 | 57.1 | 93.0 |
| Aggravated Assault | 405 | 157.3 | 330.0 |
| Property Crime | 5,661 | 2,198.8 | 2,279.1 |
| Burglary | 644 | 250.1 | 287.8 |
| Larceny-Theft | 3,918 | 1,521.8 | 1,638.9 |
| Motor Vehicle Theft | 1,099 | 426.9 | 352.4 |
| Arson | 0 | 0.0 | 0.0 |
Irving vs Texas Average
How does Irving's crime rate compare to the Texas state average?
| Metric | Irving | Texas Avg | Difference |
|---|---|---|---|
| Violent Crime Rate | 275.8 | 467.4 | -41.0% |
| Property Crime Rate | 2,198.8 | 2,498.3 | -12.0% |
| Murder Rate | 7.4 | 6.3 | +17.7% |
| Total Crime Rate | 2,474.6 | 2,965.7 | -16.6% |
Irving Crime Rate Trends
Year-over-year crime rate changes for Irving, Texas.
| Year | Coverage | Total Crime Rate | Violent Crime Rate | Property Crime Rate |
|---|---|---|---|---|
| 2024 | 257,460 | 2,474.6 | 275.8 | 2,198.8 |
| 2023 | 255,203 | 2,752.3 | 303.7 | 2,448.6 |
| 2022 | 254,141 | 2,883.4 | 340.4 | 2,543.1 |
| 2021 | 241,692 | 2,822.6 | 340.1 | 2,482.5 |
| 2020 | 242,976 | 2,845.1 | 309.1 | 2,536.1 |
| 2019 | 245,423 | 2,688.8 | 251.4 | 2,437.4 |
Frequently Asked Questions
Is Irving, Texas safe?
Irving has a safety score of 29/100, meaning it has less crime than about 29% of US cities in our FBI dataset. With a total crime rate of 2,474.6 per 100,000 residents in 2024, Irving is among the highest-crime US cities.
What is the crime rate in Irving, Texas?
According to FBI data for 2024, Irving has a violent crime rate of 275.8 per 100,000 and a property crime rate of 2,198.8 per 100,000 residents.
How does Irving compare to the national average?
Irving's total crime rate of 2,474.6 per 100,000 can be compared to the national average. The data covers 257,460 residents.
What types of crime are most common in Irving?
Based on FBI 2024 data, the most reported crimes in Irving include larceny-theft, aggravated assault, and burglary. Property crime is generally more common than violent crime.
Is Irving safe to visit?
Like any city, Irving has areas that are safer than others. The city's overall safety score is 29/100 based on FBI crime data. Standard travel precautions are recommended.