Moving from Bellevue, WA to Pomona, CA?
An out-of-state move adds a new driver's license, plates, voter registration and state-specific deadlines. The Moving Checklist Planner dates every task from your move-in day — seven tabs for Google Sheets or Excel, $12 once.
Is Bellevue, WA or Pomona, CA Safer?
According to crimebycity.com's analysis of FBI data, Pomona, CA is safer than Bellevue, WA (Safety Score 13/100 vs 13/100), with a total crime rate of 3,473 per 100,000 versus 3,479 for Bellevue, WA — 0% lower. Bellevue has lower rates in 5 of 7 crime categories.
The biggest difference is in murder, where Bellevue has a 92% lower rate.
Quiz: which of these is SAFER than Bellevue, WA?
Bellevue — 5-Year Trend
 Violent
Property
Total
Pomona — 5-Year Trend
Violent
 Property
Total
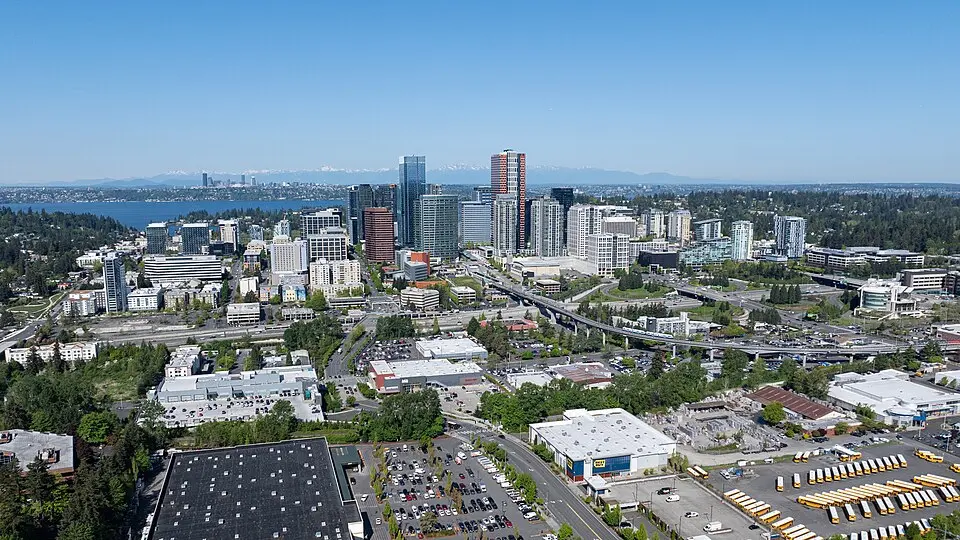
Bellevue, WA
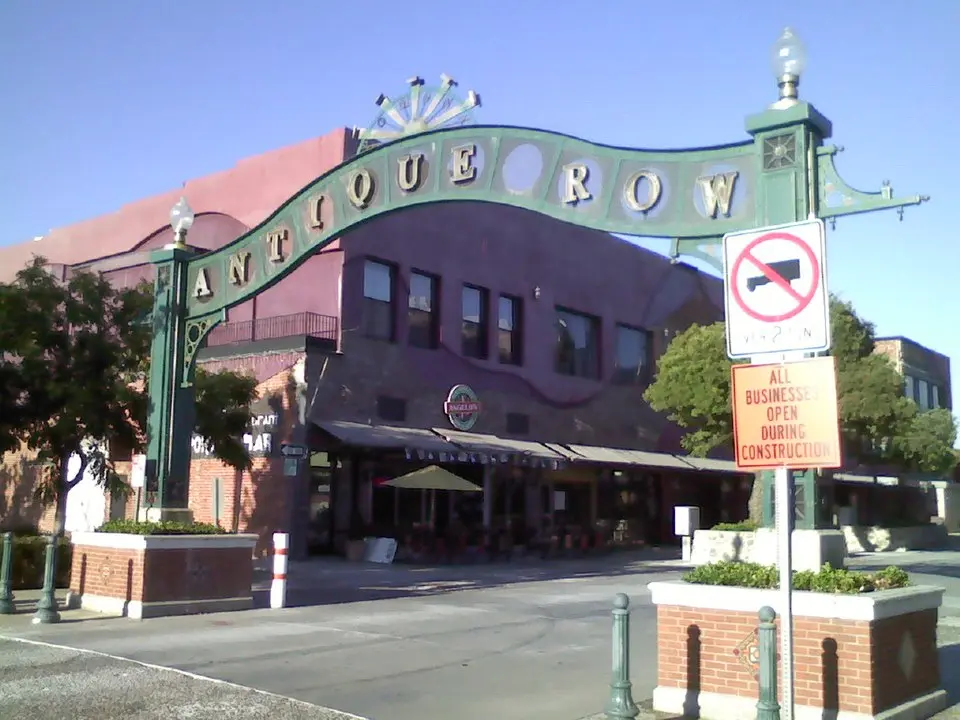
Pomona, CA
Detailed Crime Rate Comparison
| Crime Type | Bellevue | Pomona | Difference |
|---|---|---|---|
| Total Crime Rate | 3,479.4 | 3,473.3 | +6.1 |
| Violent Crime Rate | 139.9 | 720.1 | -580.2 |
| Murder Rate | 0.7 | 8.4 | -7.7 |
| Rape Rate | 9.9 | 42.4 | -32.5 |
| Robbery Rate | 50.8 | 217.8 | -167.0 |
| Aggravated Assault Rate | 77.2 | 447.4 | -370.2 |
| Property Crime Rate | 3,339.5 | 2,753.2 | +586.3 |
| Burglary Rate | 362.3 | 420.2 | -57.9 |
| Larceny-Theft Rate | 2,636.6 | 1,740.1 | +896.5 |
| Motor Vehicle Theft Rate | 340.6 | 592.8 | -252.2 |
All rates per 100,000 residents. Source: FBI UCR.
Moving from Bellevue, WA to Pomona, CA?
An out-of-state move adds new driver's license, plates, voter registration and deadlines that differ by state. The Moving Checklist Planner dates every task from your move-in day — seven tabs for Google Sheets or Excel, $12 once.
Frequently Asked Questions
Is Bellevue or Pomona safer?
Pomona, CA is safer with a total crime rate of 3,473 per 100K vs 3,479 for Bellevue, WA — a 0% difference.
How do violent crime rates compare?
Bellevue has a violent crime rate of 139.9 per 100K while Pomona has 720.1. Bellevue has lower violent crime.
About Bellevue, WA
Bellevue, "Beautiful View" in French, began as a logging town and now boasts a vibrant tech industry. Situated across Lake Washington from Seattle, it's a rapidly growing city with a diverse, affluent population. With a safety score of 13/100 and a population coverage of 151,520, Bellevue has a total crime rate of 3,479.4 per 100,000 residents.
About Pomona, CA
Pomona, a city in eastern Los Angeles County, was once known for its citrus industry. It's home to Cal Poly Pomona and diverse communities, situated at the base of the San Gabriel Mountains. With a safety score of 13/100 and a population coverage of 143,726, Pomona has a total crime rate of 3,473.3 per 100,000 residents.