Is Belmont or Prescott Safer?
According to crimebycity.com's analysis of 2024 FBI data, Belmont is safer than Prescott (Safety Score 58/100 vs 58/100), with a total crime rate of 1,448 per 100,000 versus 1,454 for Prescott — 0% lower. Belmont has higher rates in 2 of 7 crime categories.
The biggest difference is in violent crime, where Belmont has a 51% lower rate.
Belmont — 5-Year Trend
 Violent
 Property
Total
Property
Total
Prescott — 5-Year Trend
Violent
Property
Total
Belmont, CA
Prescott, AZ
Detailed Crime Rate Comparison
| Crime Type | Belmont | Prescott | Difference |
|---|---|---|---|
| Total Crime Rate | 1,448.3 | 1,454.3 | -6.0 |
| Violent Crime Rate | 164.8 | 337.2 | -172.4 |
| Murder Rate | 3.8 | 2.1 | +1.8 |
| Rape Rate | 19.2 | 22.8 | -3.6 |
| Robbery Rate | 34.5 | 18.6 | +15.9 |
| Aggravated Assault Rate | 107.3 | 291.7 | -184.4 |
| Property Crime Rate | 1,283.6 | 1,117.1 | +166.5 |
| Burglary Rate | 118.8 | 223.4 | -104.6 |
| Larceny-Theft Rate | 1,053.7 | 846.1 | +207.6 |
| Motor Vehicle Theft Rate | 111.1 | 47.6 | +63.5 |
All rates per 100,000 residents. Source: FBI UCR 2024.
Frequently Asked Questions
Is Belmont or Prescott safer?
Belmont is safer with a total crime rate of 1,448 per 100K vs 1,454 for Prescott — a 0% difference.
How do violent crime rates compare?
Belmont has a violent crime rate of 164.8 per 100K while Prescott has 337.2. Belmont has lower violent crime.
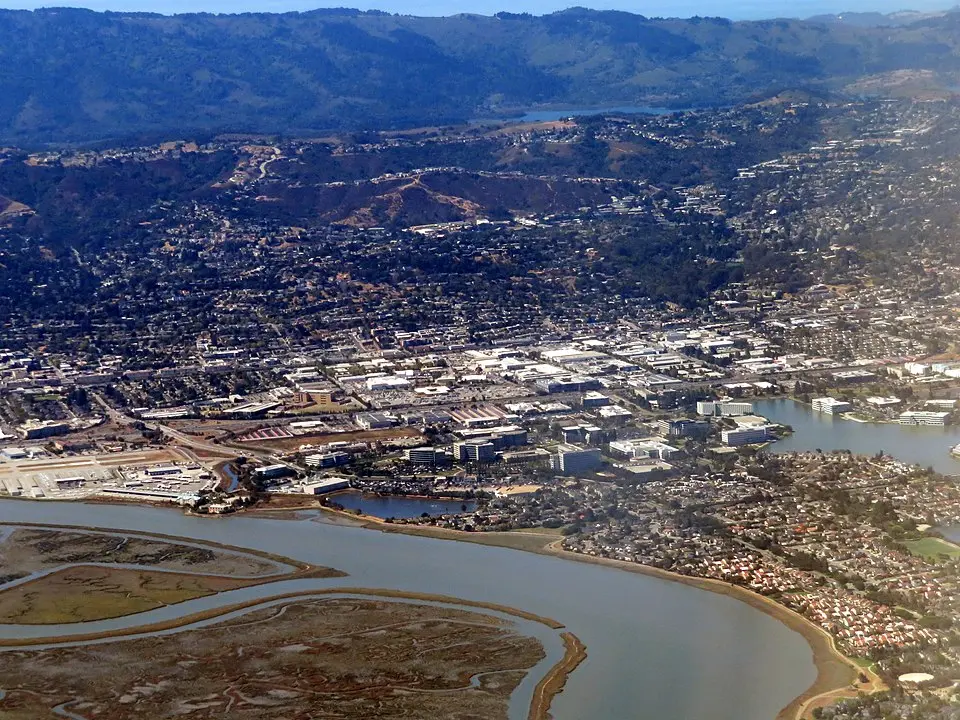
About Belmont, CA
Belmont, California, a San Francisco Peninsula city, was once part of Rancho de las Pulgas. Home to Notre Dame de Namur University, it's primarily a residential community with a diverse population. With a safety score of 58/100 and a population coverage of 26,099, Belmont has a total crime rate of 1,448.3 per 100,000 residents.
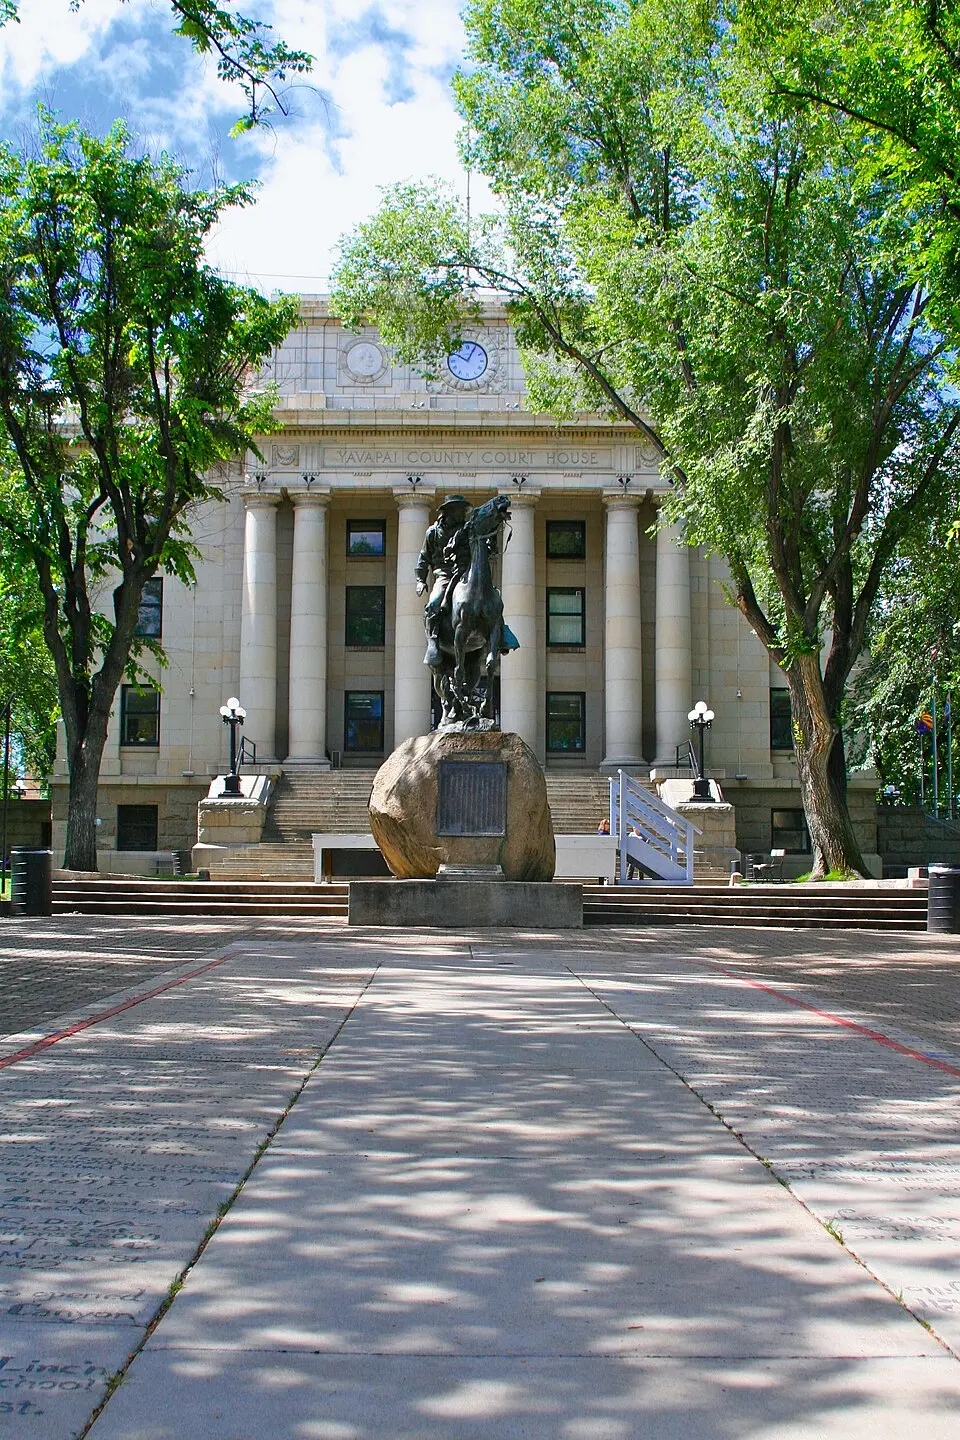
About Prescott, AZ
Prescott, Arizona, known for its "Everybody's Hometown" moniker, sits in the Bradshaw Mountains. This Yavapai County seat, once the Territorial Capital, boasts a population of around 48,000, attracting retirees and outdoor enthusiasts. With a safety score of 58/100 and a population coverage of 48,339, Prescott has a total crime rate of 1,454.3 per 100,000 residents.