Is Belton or Burlingame Safer?
According to crimebycity.com's analysis of 2024 FBI data, Belton is safer than Burlingame (Safety Score 35/100 vs 35/100), with a total crime rate of 2,207 per 100,000 versus 2,209 for Burlingame — 0% lower. Belton has higher rates in 3 of 6 crime categories.
The biggest difference is in robbery, where Burlingame has a 56% lower rate.
Belton — 5-Year Trend
 Violent
 Property
Total
Property
Total
Burlingame — 5-Year Trend
Violent
Property
Total
Belton, MO
Burlingame, CA
Detailed Crime Rate Comparison
| Crime Type | Belton | Burlingame | Difference |
|---|---|---|---|
| Total Crime Rate | 2,206.6 | 2,209.0 | -2.3 |
| Violent Crime Rate | 333.9 | 183.2 | +150.6 |
| Murder Rate | 0.0 | 0.0 | +0.0 |
| Rape Rate | 76.8 | 33.9 | +42.8 |
| Robbery Rate | 46.1 | 20.4 | +25.7 |
| Aggravated Assault Rate | 211.1 | 128.9 | +82.1 |
| Property Crime Rate | 1,872.8 | 2,025.7 | -153.0 |
| Burglary Rate | 88.3 | 98.4 | -10.1 |
| Larceny-Theft Rate | 1,592.6 | 1,740.7 | -148.1 |
| Motor Vehicle Theft Rate | 191.9 | 186.6 | +5.3 |
All rates per 100,000 residents. Source: FBI UCR 2024.
Frequently Asked Questions
Is Belton or Burlingame safer?
Belton is safer with a total crime rate of 2,207 per 100K vs 2,209 for Burlingame — a 0% difference.
How do violent crime rates compare?
Belton has a violent crime rate of 333.9 per 100K while Burlingame has 183.2. Burlingame has lower violent crime.
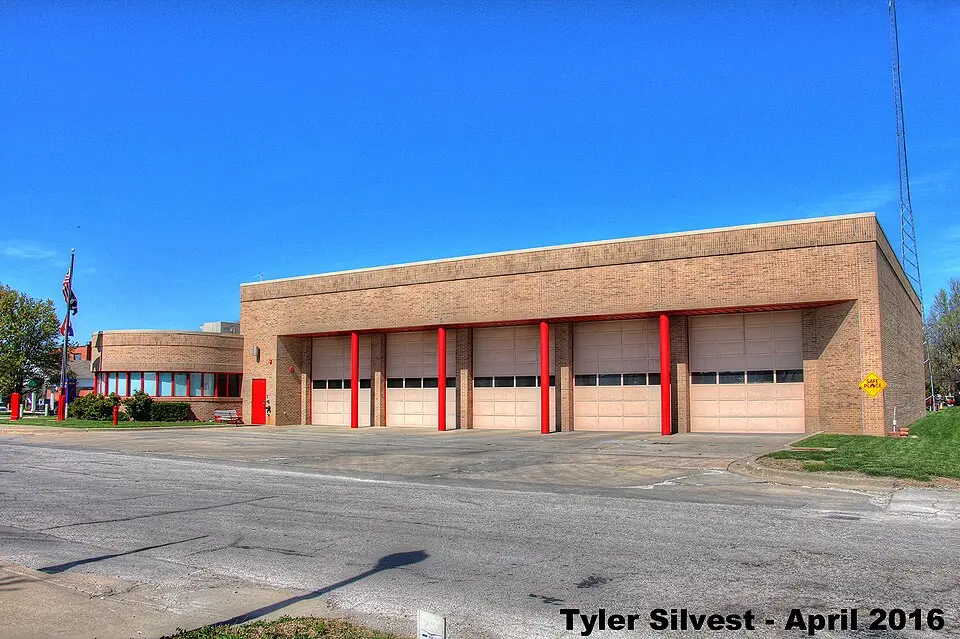
About Belton, MO
Belton, Missouri, a city in Cass County, grew with the arrival of the Kansas City Southern Railway. It's home to roughly 24,000 residents, situated south of Kansas City. With a safety score of 35/100 and a population coverage of 26,058, Belton has a total crime rate of 2,206.6 per 100,000 residents.
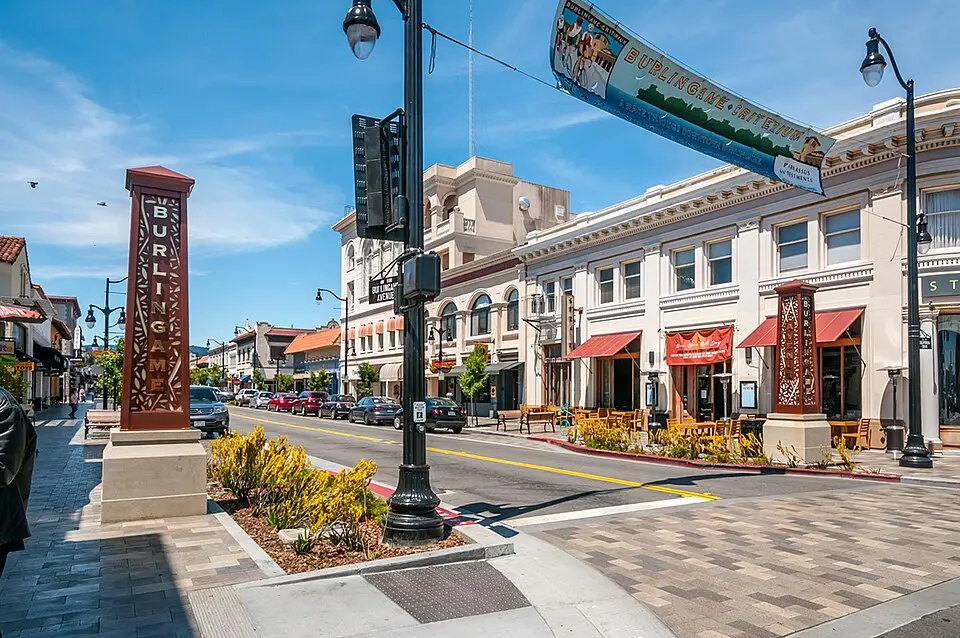
About Burlingame, CA
Burlingame, "City of Trees," is an affluent San Francisco Peninsula city. It's home to many tech workers and boasts a vibrant downtown near San Francisco International Airport. With a safety score of 35/100 and a population coverage of 29,471, Burlingame has a total crime rate of 2,209.0 per 100,000 residents.