Is Bixby or East Hempfield Township Safer?
According to crimebycity.com's analysis of 2024 FBI data, Bixby is safer than East Hempfield Township (Safety Score 79/100 vs 79/100), with a total crime rate of 860 per 100,000 versus 870 for East Hempfield Township — 1% lower. Bixby has lower rates in 4 of 7 crime categories.
The biggest difference is in murder, where Bixby has a 100% lower rate.
Bixby — 5-Year Trend
 Violent
 Property
Total
Property
Total
East Hempfield Township — 5-Year Trend
Violent
Property
 Total
Total
Bixby, OK
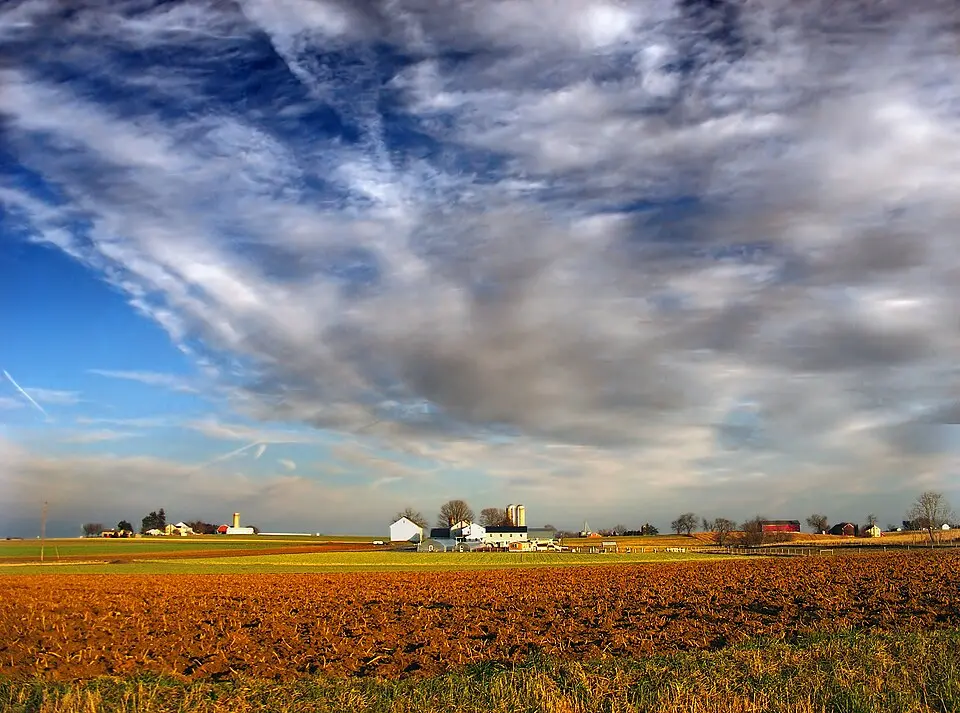
East Hempfield Township, PA
Detailed Crime Rate Comparison
| Crime Type | Bixby | East Hempfield Township | Difference |
|---|---|---|---|
| Total Crime Rate | 860.4 | 869.7 | -9.3 |
| Violent Crime Rate | 162.5 | 51.6 | +110.9 |
| Murder Rate | 0.0 | 3.7 | -3.7 |
| Rape Rate | 22.3 | 3.7 | +18.6 |
| Robbery Rate | 3.2 | 11.1 | -7.9 |
| Aggravated Assault Rate | 133.8 | 33.2 | +100.7 |
| Property Crime Rate | 697.9 | 818.1 | -120.2 |
| Burglary Rate | 153.0 | 95.8 | +57.1 |
| Larceny-Theft Rate | 471.6 | 678.1 | -206.5 |
| Motor Vehicle Theft Rate | 73.3 | 44.2 | +29.1 |
All rates per 100,000 residents. Source: FBI UCR 2024.
Frequently Asked Questions
Is Bixby or East Hempfield Township safer?
Bixby is safer with a total crime rate of 860 per 100K vs 870 for East Hempfield Township — a 1% difference.
How do violent crime rates compare?
Bixby has a violent crime rate of 162.5 per 100K while East Hempfield Township has 51.6. East Hempfield Township has lower violent crime.
About Bixby, OK
Bixby, "The Herb Capital of the World," is a growing suburb south of Tulsa. Its residents, predominantly white, enjoy a community once centered on agriculture along the Arkansas River. With a safety score of 79/100 and a population coverage of 31,380, Bixby has a total crime rate of 860.4 per 100,000 residents.
About East Hempfield Township, PA
East Hempfield Township, a Lancaster County municipality, was historically part of Hempfield Township until 1929. Situated west of the city of Lancaster, it is primarily a suburban and agricultural area with a growing population. With a safety score of 79/100 and a population coverage of 27,135, East Hempfield Township has a total crime rate of 869.7 per 100,000 residents.
More Crime Rate Comparisons
Compare Bixby
Compare East Hempfield Township
- Is East Hempfield Township safer than Philadelphia, PA?
- Is East Hempfield Township safer than San Antonio, TX?
- Is East Hempfield Township safer than San Diego, CA?
- Is East Hempfield Township safer than Dallas, TX?
- Is East Hempfield Township safer than Charlotte - Mecklenburg, NC?
- Is East Hempfield Township safer than Fort Worth, TX?