Is Brentwood or Lawrence Safer?
According to crimebycity.com's analysis of 2024 FBI data, Lawrence is safer than Brentwood (Safety Score 26/100 vs 26/100), with a total crime rate of 2,627 per 100,000 versus 2,633 for Brentwood — 0% lower. Brentwood has higher rates in 3 of 7 crime categories.
The biggest difference is in murder, where Brentwood has a 100% lower rate.
Brentwood — 5-Year Trend
 Violent
 Property
Total
Property
Total
Lawrence — 4-Year Trend
Violent
Property
Total
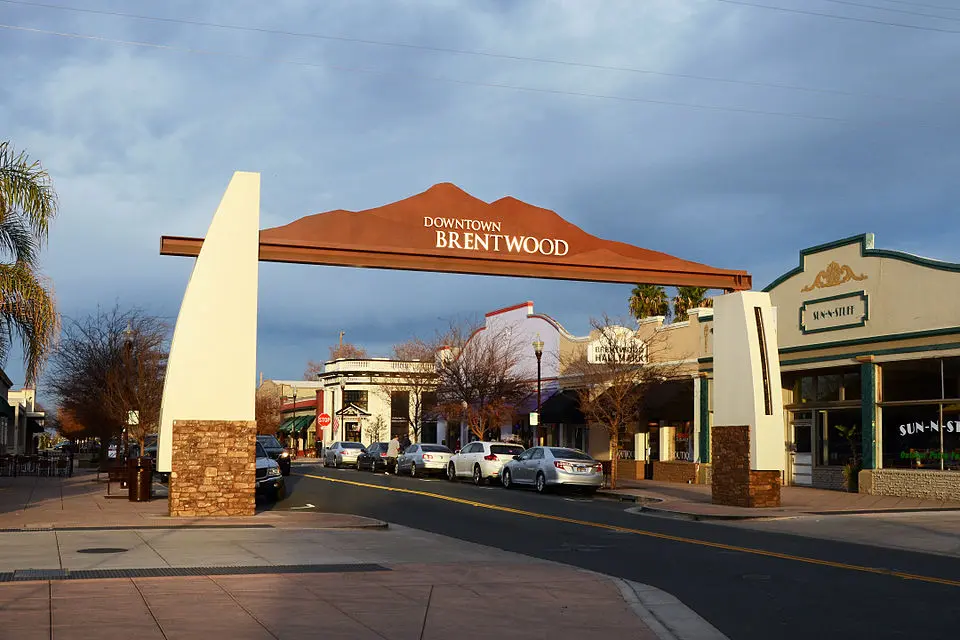
Brentwood, CA
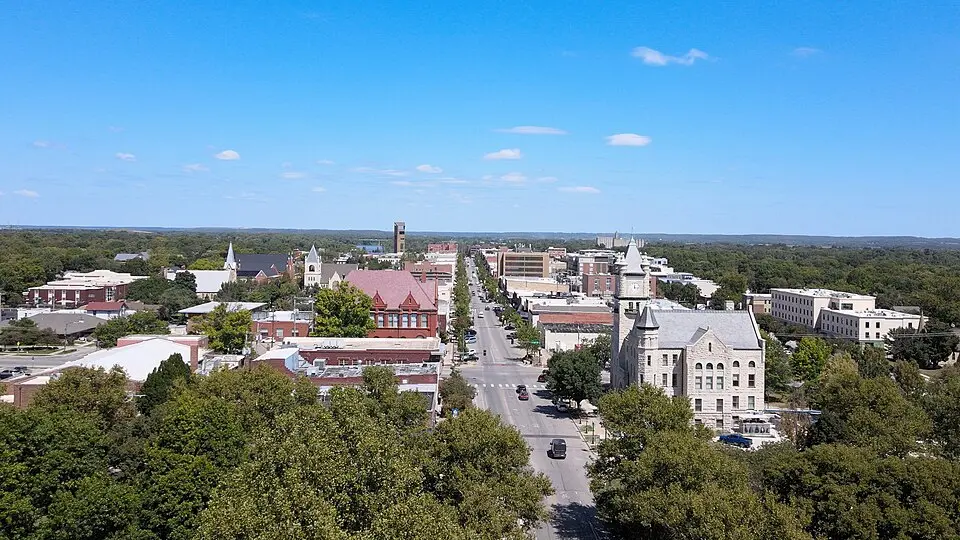
Lawrence, KS
Detailed Crime Rate Comparison
| Crime Type | Brentwood | Lawrence | Difference |
|---|---|---|---|
| Total Crime Rate | 2,633.4 | 2,627.4 | +6.0 |
| Violent Crime Rate | 243.3 | 470.8 | -227.5 |
| Murder Rate | 0.0 | 5.2 | -5.2 |
| Rape Rate | 30.6 | 74.5 | -43.9 |
| Robbery Rate | 90.3 | 33.1 | +57.2 |
| Aggravated Assault Rate | 120.9 | 348.7 | -227.9 |
| Property Crime Rate | 2,390.1 | 2,156.6 | +233.6 |
| Burglary Rate | 220.4 | 229.7 | -9.4 |
| Larceny-Theft Rate | 1,912.7 | 1,762.3 | +150.4 |
| Motor Vehicle Theft Rate | 257.1 | 164.5 | +92.5 |
All rates per 100,000 residents. Source: FBI UCR 2024.
Frequently Asked Questions
Is Brentwood or Lawrence safer?
Lawrence is safer with a total crime rate of 2,627 per 100K vs 2,633 for Brentwood — a 0% difference.
How do violent crime rates compare?
Brentwood has a violent crime rate of 243.3 per 100K while Lawrence has 470.8. Brentwood has lower violent crime.
About Brentwood, CA
Brentwood, a Los Angeles neighborhood home to the Getty Center, stretches from the Santa Monica Mountains to the Pacific Ocean. Its affluent residents enjoy a Mediterranean climate. With a safety score of 26/100 and a population coverage of 65,352, Brentwood has a total crime rate of 2,633.4 per 100,000 residents.
About Lawrence, KS
Lawrence, Kansas, home to the University of Kansas Jayhawks, sits on the Kansas River. This vibrant college town, with a population around 97,000, played a significant role in the Bleeding Kansas era. With a safety score of 26/100 and a population coverage of 96,636, Lawrence has a total crime rate of 2,627.4 per 100,000 residents.