Is Burbank or San Gabriel Safer?
According to crimebycity.com's analysis of 2024 FBI data, San Gabriel is safer than Burbank (Safety Score 37/100 vs 36/100), with a total crime rate of 2,149 per 100,000 versus 2,163 for Burbank — 1% lower. Burbank has lower rates in 4 of 7 crime categories.
The biggest difference is in murder, where Burbank has a 100% lower rate.
Burbank — 5-Year Trend
 Violent
 Property
Total
Property
Total
San Gabriel — 5-Year Trend
 Violent
Property
Total
Violent
Property
Total
Burbank, IL

San Gabriel, CA
Detailed Crime Rate Comparison
| Crime Type | Burbank | San Gabriel | Difference |
|---|---|---|---|
| Total Crime Rate | 2,163.1 | 2,149.5 | +13.7 |
| Violent Crime Rate | 198.0 | 182.9 | +15.0 |
| Murder Rate | 0.0 | 2.7 | -2.7 |
| Rape Rate | 54.0 | 10.8 | +43.2 |
| Robbery Rate | 61.2 | 67.3 | -6.1 |
| Aggravated Assault Rate | 82.8 | 102.2 | -19.5 |
| Property Crime Rate | 1,965.2 | 1,966.5 | -1.4 |
| Burglary Rate | 381.5 | 513.8 | -132.3 |
| Larceny-Theft Rate | 1,292.1 | 1,283.2 | +8.9 |
| Motor Vehicle Theft Rate | 291.5 | 169.5 | +122.1 |
All rates per 100,000 residents. Source: FBI UCR 2024.
Frequently Asked Questions
Is Burbank or San Gabriel safer?
San Gabriel is safer with a total crime rate of 2,149 per 100K vs 2,163 for Burbank — a 1% difference.
How do violent crime rates compare?
Burbank has a violent crime rate of 198.0 per 100K while San Gabriel has 182.9. San Gabriel has lower violent crime.
About Burbank, IL
Burbank, Illinois, a southwestern suburb of Chicago, was incorporated in 1942. This Cook County community is primarily residential, with a diverse population. With a safety score of 36/100 and a population coverage of 27,784, Burbank has a total crime rate of 2,163.1 per 100,000 residents.
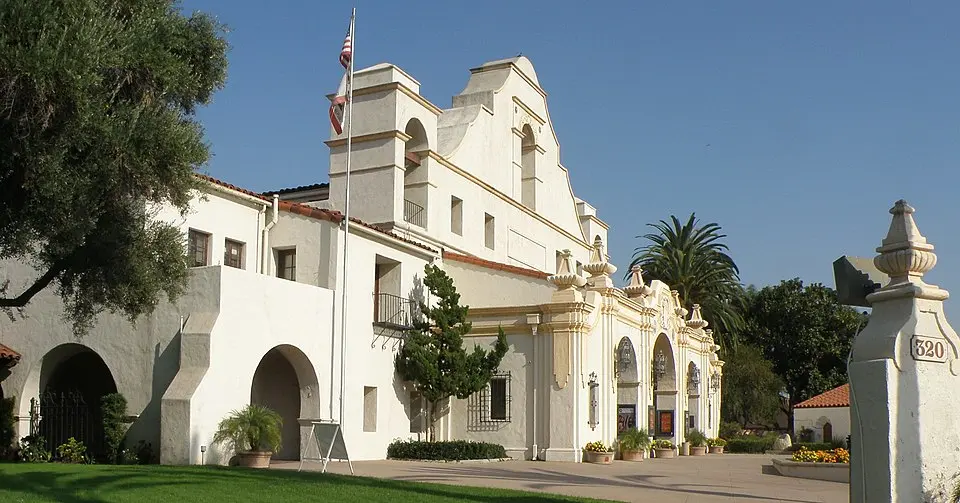
About San Gabriel, CA
San Gabriel, California, is home to the historic Mission San Gabriel Arcángel, one of California's oldest missions. Located in the San Gabriel Valley, it's a diverse community with a significant Asian population. With a safety score of 37/100 and a population coverage of 37,172, San Gabriel has a total crime rate of 2,149.5 per 100,000 residents.