Is Burlington or Woonsocket Safer?
According to crimebycity.com's analysis of 2024 FBI data, Burlington is safer than Woonsocket (Safety Score 44/100 vs 44/100), with a total crime rate of 1,888 per 100,000 versus 1,891 for Woonsocket — 0% lower. Burlington has lower rates in 5 of 7 crime categories.
The biggest difference is in murder, where Burlington has a 100% lower rate.
Burlington — 5-Year Trend
 Violent
Property
Total
Violent
Property
Total
Woonsocket — 5-Year Trend
 Violent
Property
Total
Violent
Property
Total
Burlington, MA
Woonsocket, RI
Detailed Crime Rate Comparison
| Crime Type | Burlington | Woonsocket | Difference |
|---|---|---|---|
| Total Crime Rate | 1,887.6 | 1,891.5 | -3.8 |
| Violent Crime Rate | 224.9 | 390.6 | -165.7 |
| Murder Rate | 0.0 | 4.6 | -4.6 |
| Rape Rate | 22.1 | 59.4 | -37.3 |
| Robbery Rate | 14.8 | 80.0 | -65.2 |
| Aggravated Assault Rate | 188.0 | 246.7 | -58.7 |
| Property Crime Rate | 1,662.7 | 1,500.8 | +161.9 |
| Burglary Rate | 95.9 | 185.0 | -89.2 |
| Larceny-Theft Rate | 1,519.0 | 1,130.8 | +388.2 |
| Motor Vehicle Theft Rate | 47.9 | 185.0 | -137.1 |
All rates per 100,000 residents. Source: FBI UCR 2024.
Frequently Asked Questions
Is Burlington or Woonsocket safer?
Burlington is safer with a total crime rate of 1,888 per 100K vs 1,891 for Woonsocket — a 0% difference.
How do violent crime rates compare?
Burlington has a violent crime rate of 224.9 per 100K while Woonsocket has 390.6. Burlington has lower violent crime.
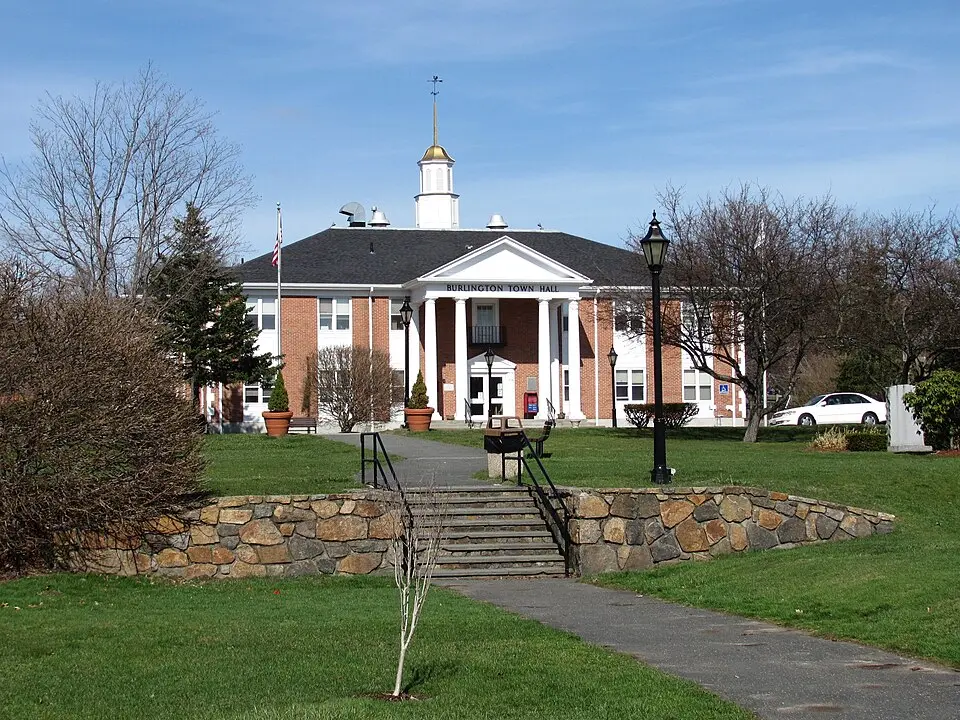
About Burlington, MA
Burlington, MA, a Middlesex County suburb, is known for its robust tech industry and the Burlington Mall. It was incorporated in 1799, separating from Woburn, and is home to a diverse, affluent population. With a safety score of 44/100 and a population coverage of 27,124, Burlington has a total crime rate of 1,887.6 per 100,000 residents.
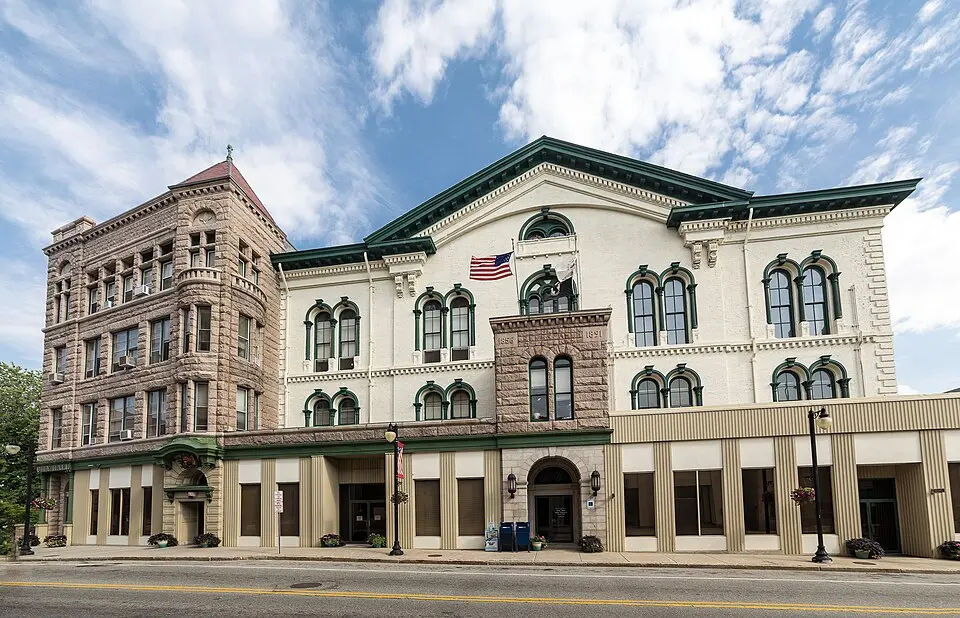
About Woonsocket, RI
Woonsocket, once a textile manufacturing hub known for its French-Canadian heritage, lies in northern Rhode Island along the Blackstone River. This mill city, with a population around 43,000, features dense urban housing and historic industrial architecture. With a safety score of 44/100 and a population coverage of 43,776, Woonsocket has a total crime rate of 1,891.5 per 100,000 residents.