Is Cumberland or Lower Makefield Township Safer?
According to crimebycity.com's analysis of 2024 FBI data, Cumberland is safer than Lower Makefield Township (Safety Score 89/100 vs 88/100), with a total crime rate of 594 per 100,000 versus 602 for Lower Makefield Township — 1% lower. Cumberland has lower rates in 4 of 6 crime categories.
The biggest difference is in murder, where Cumberland has a 100% lower rate.
Cumberland — 5-Year Trend
 Violent
Property
Total
Violent
Property
Total
Lower Makefield Township — 5-Year Trend
 Violent
Property
Total
Violent
Property
Total
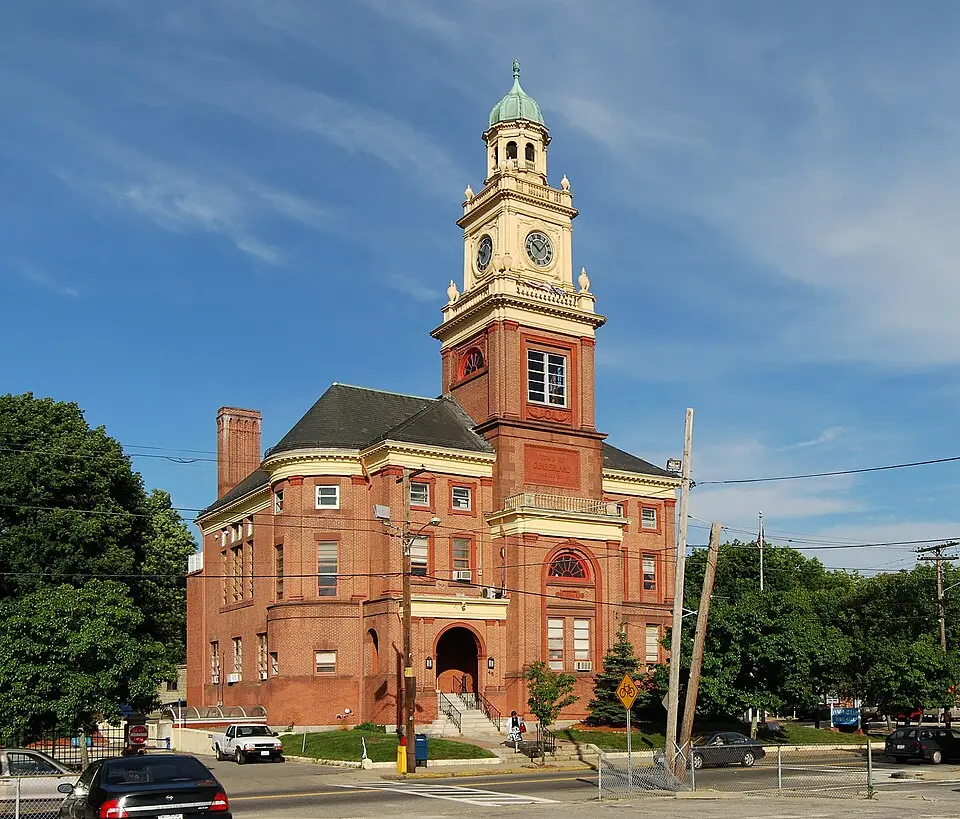
Cumberland, RI
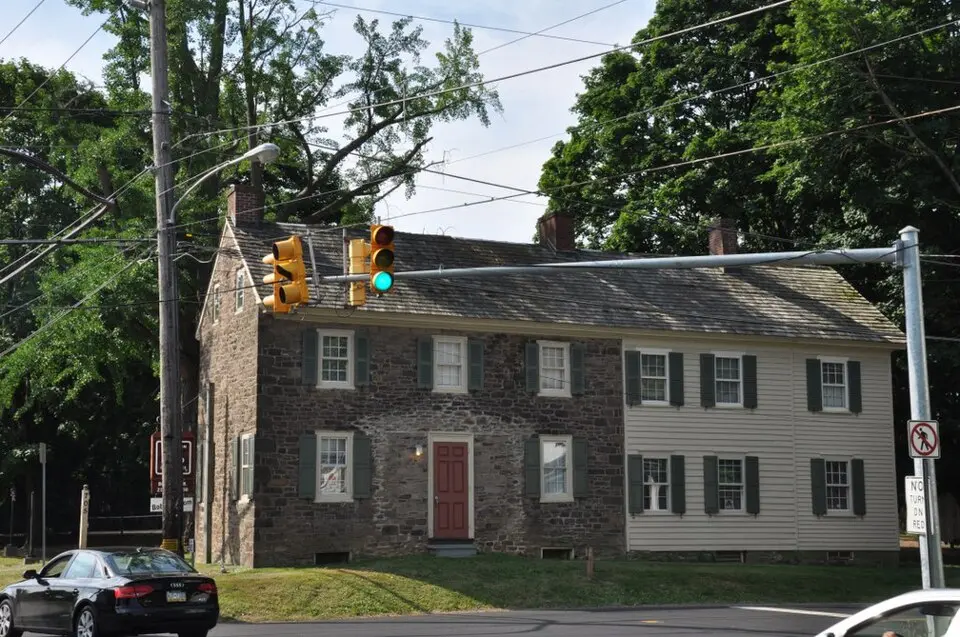
Lower Makefield Township, PA
Detailed Crime Rate Comparison
| Crime Type | Cumberland | Lower Makefield Township | Difference |
|---|---|---|---|
| Total Crime Rate | 593.9 | 601.8 | -7.9 |
| Violent Crime Rate | 59.1 | 29.9 | +29.2 |
| Murder Rate | 0.0 | 3.0 | -3.0 |
| Rape Rate | 21.5 | 0.0 | +21.5 |
| Robbery Rate | 0.0 | 0.0 | +0.0 |
| Aggravated Assault Rate | 37.6 | 27.0 | +10.7 |
| Property Crime Rate | 534.8 | 571.9 | -37.1 |
| Burglary Rate | 51.1 | 53.9 | -2.8 |
| Larceny-Theft Rate | 405.8 | 452.1 | -46.3 |
| Motor Vehicle Theft Rate | 77.9 | 65.9 | +12.1 |
All rates per 100,000 residents. Source: FBI UCR 2024.
Frequently Asked Questions
Is Cumberland or Lower Makefield Township safer?
Cumberland is safer with a total crime rate of 594 per 100K vs 602 for Lower Makefield Township — a 1% difference.
How do violent crime rates compare?
Cumberland has a violent crime rate of 59.1 per 100K while Lower Makefield Township has 29.9. Lower Makefield Township has lower violent crime.
About Cumberland, RI
Cumberland, a town in northern Rhode Island, boasts the historic Cumberland Company's Ashton Mill. With a population exceeding 36,000, it's situated along the Blackstone River. With a safety score of 89/100 and a population coverage of 37,213, Cumberland has a total crime rate of 593.9 per 100,000 residents.
About Lower Makefield Township, PA
Lower Makefield Township, a Bucks County suburb, encompasses historic Washington Crossing State Park along the Delaware River. Predominantly residential, it's home to over 32,000 residents. With a safety score of 88/100 and a population coverage of 33,400, Lower Makefield Township has a total crime rate of 601.8 per 100,000 residents.
More Crime Rate Comparisons
Compare Cumberland
Compare Lower Makefield Township
- Is Lower Makefield Township safer than Philadelphia, PA?
- Is Lower Makefield Township safer than San Antonio, TX?
- Is Lower Makefield Township safer than San Diego, CA?
- Is Lower Makefield Township safer than Dallas, TX?
- Is Lower Makefield Township safer than Charlotte - Mecklenburg, NC?
- Is Lower Makefield Township safer than Fort Worth, TX?