Is Dinuba or Williston Safer?
According to crimebycity.com's analysis of 2024 FBI data, Williston is safer than Dinuba (Safety Score 23/100 vs 23/100), with a total crime rate of 2,753 per 100,000 versus 2,768 for Dinuba — 1% lower. Dinuba has higher rates in 3 of 6 crime categories.
The biggest difference is in robbery, where Williston has a 72% lower rate.
Dinuba — 5-Year Trend
 Violent
 Property
Total
Property
Total
Williston — 5-Year Trend
Violent
Property
Total
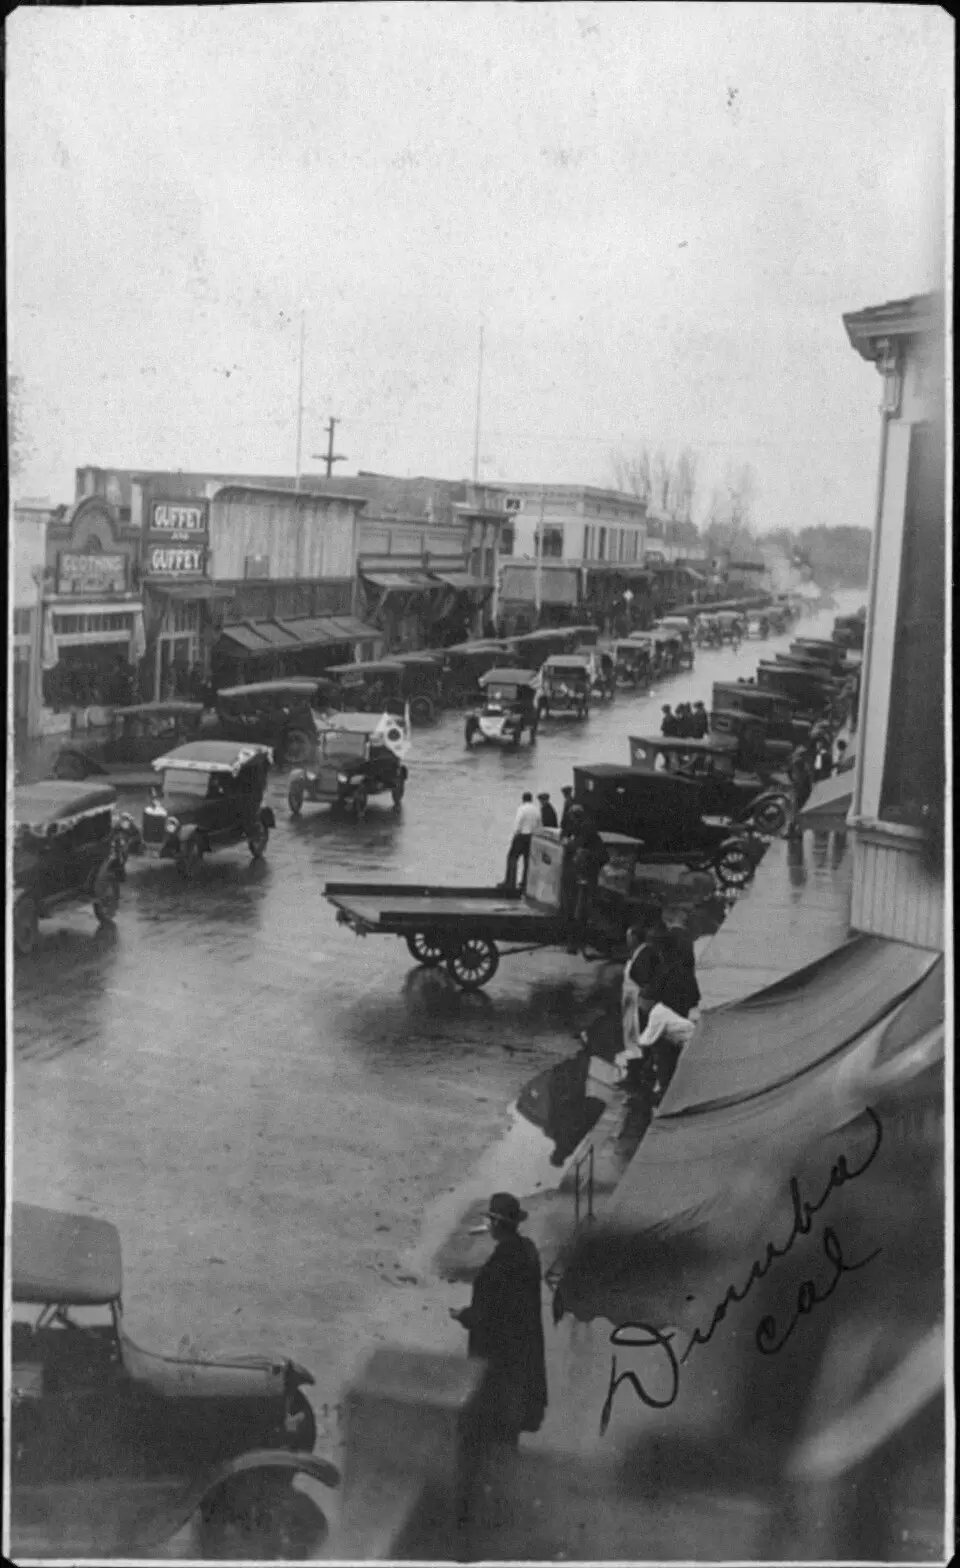
Dinuba, CA
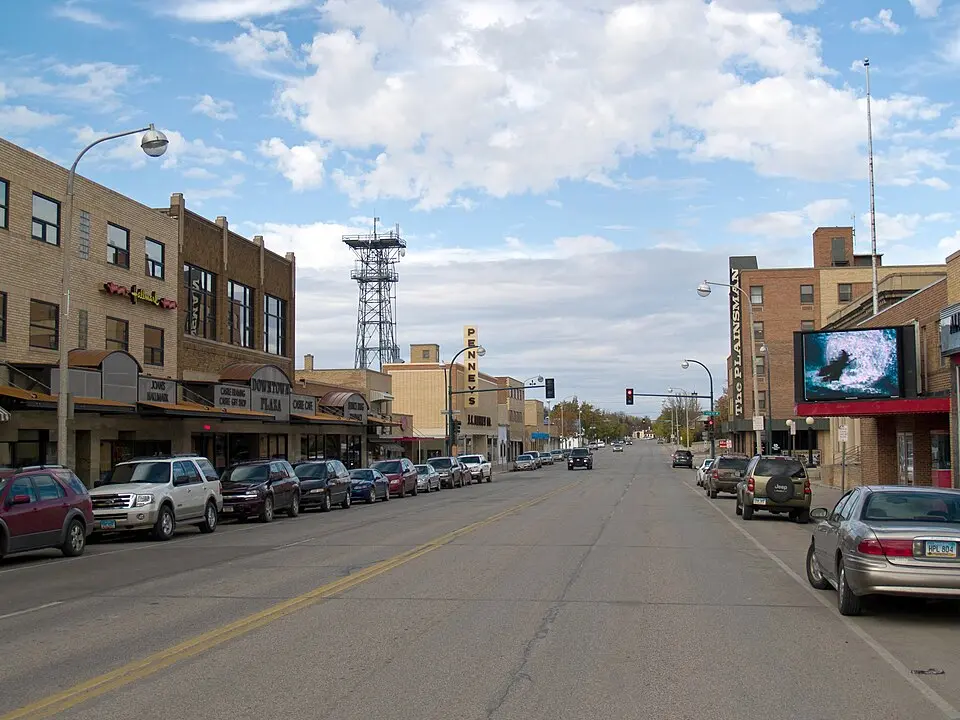
Williston, ND
Detailed Crime Rate Comparison
| Crime Type | Dinuba | Williston | Difference |
|---|---|---|---|
| Total Crime Rate | 2,767.8 | 2,752.6 | +15.3 |
| Violent Crime Rate | 579.5 | 437.3 | +142.2 |
| Murder Rate | 0.0 | 0.0 | +0.0 |
| Rape Rate | 41.9 | 77.2 | -35.2 |
| Robbery Rate | 64.8 | 18.4 | +46.4 |
| Aggravated Assault Rate | 472.7 | 341.8 | +131.0 |
| Property Crime Rate | 2,188.3 | 2,315.2 | -126.9 |
| Burglary Rate | 236.4 | 341.8 | -105.4 |
| Larceny-Theft Rate | 1,647.0 | 1,745.6 | -98.6 |
| Motor Vehicle Theft Rate | 305.0 | 227.9 | +77.1 |
All rates per 100,000 residents. Source: FBI UCR 2024.
Frequently Asked Questions
Is Dinuba or Williston safer?
Williston is safer with a total crime rate of 2,753 per 100K vs 2,768 for Dinuba — a 1% difference.
How do violent crime rates compare?
Dinuba has a violent crime rate of 579.5 per 100K while Williston has 437.3. Williston has lower violent crime.
About Dinuba, CA
Nestled in the agricultural heartland of the San Joaquin Valley, Dinuba is a small city with a rich farming heritage, evident in its annual Raisin Day Festival. Its population of around 25,000 residents enjoys a warm, Mediterranean climate. With a safety score of 23/100 and a population coverage of 26,230, Dinuba has a total crime rate of 2,767.8 per 100,000 residents.
About Williston, ND
Williston, a hub in the Bakken oil region, sits near the confluence of the Yellowstone and Missouri rivers. This city of over 29,000 residents experienced a significant population boom during the 21st-century oil boom, a testament to its role in the state's energy economy. With a safety score of 23/100 and a population coverage of 27,211, Williston has a total crime rate of 2,752.6 per 100,000 residents.