Is Frederick or Round Rock Safer?
According to crimebycity.com's analysis of 2024 FBI data, Round Rock is safer than Frederick (Safety Score 38/100 vs 38/100), with a total crime rate of 2,071 per 100,000 versus 2,080 for Frederick — 0% lower. Frederick has higher rates in 3 of 7 crime categories.
The biggest difference is in violent crime, where Round Rock has a 68% lower rate.
Frederick — 5-Year Trend
 Violent
 Property
Total
Property
Total
Round Rock — 5-Year Trend
 Violent
Property
Total
Violent
Property
Total
Frederick, MD
Round Rock, TX
Detailed Crime Rate Comparison
| Crime Type | Frederick | Round Rock | Difference |
|---|---|---|---|
| Total Crime Rate | 2,079.7 | 2,071.4 | +8.2 |
| Violent Crime Rate | 406.0 | 130.7 | +275.3 |
| Murder Rate | 2.3 | 1.5 | +0.8 |
| Rape Rate | 55.4 | 29.1 | +26.3 |
| Robbery Rate | 52.0 | 17.2 | +34.8 |
| Aggravated Assault Rate | 296.3 | 82.9 | +213.4 |
| Property Crime Rate | 1,673.7 | 1,940.7 | -267.0 |
| Burglary Rate | 244.3 | 170.3 | +74.0 |
| Larceny-Theft Rate | 1,317.5 | 1,629.2 | -311.8 |
| Motor Vehicle Theft Rate | 112.0 | 141.2 | -29.2 |
All rates per 100,000 residents. Source: FBI UCR 2024.
Frequently Asked Questions
Is Frederick or Round Rock safer?
Round Rock is safer with a total crime rate of 2,071 per 100K vs 2,080 for Frederick — a 0% difference.
How do violent crime rates compare?
Frederick has a violent crime rate of 406.0 per 100K while Round Rock has 130.7. Round Rock has lower violent crime.
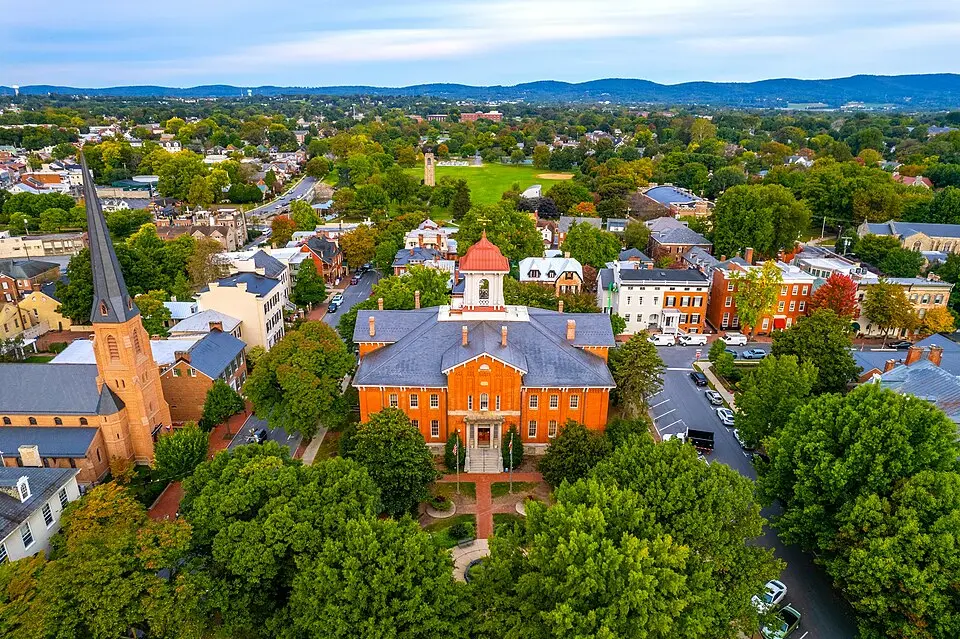
About Frederick, MD
Nestled in the Monocacy Valley, Frederick is a growing city with a rich Civil War history, home to the National Museum of Civil War Medicine. Its proximity to Washington D.C. and Baltimore makes it a commuter hub. With a safety score of 38/100 and a population coverage of 88,428, Frederick has a total crime rate of 2,079.7 per 100,000 residents.
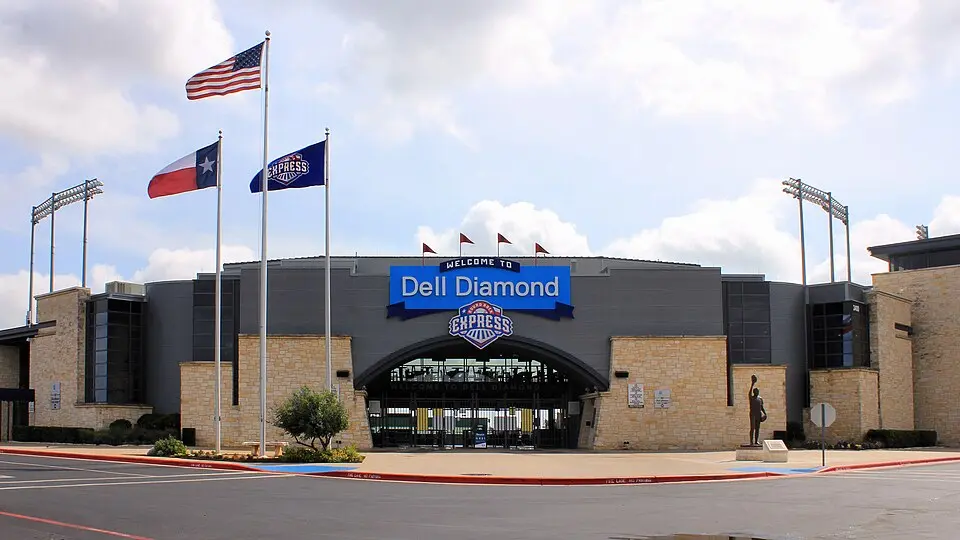
About Round Rock, TX
Round Rock, home to Dell Technologies, is a growing city north of Austin. Situated on the Balcones Escarpment, it blends suburban development with natural features along Brushy Creek. Its population has surged, nearing 120,000 residents. With a safety score of 38/100 and a population coverage of 133,868, Round Rock has a total crime rate of 2,071.4 per 100,000 residents.