Is Grand Junction or Richmond Safer?
According to crimebycity.com's analysis of 2024 FBI data, Richmond is safer than Grand Junction (Safety Score 11/100 vs 11/100), with a total crime rate of 3,685 per 100,000 versus 3,718 for Grand Junction — 1% lower. Grand Junction has lower rates in 4 of 7 crime categories.
The biggest difference is in robbery, where Grand Junction has a 79% lower rate.
Grand Junction — 5-Year Trend
 Violent
 Property
Total
Property
Total
Richmond — 5-Year Trend
 Violent
Property
Total
Violent
Property
Total
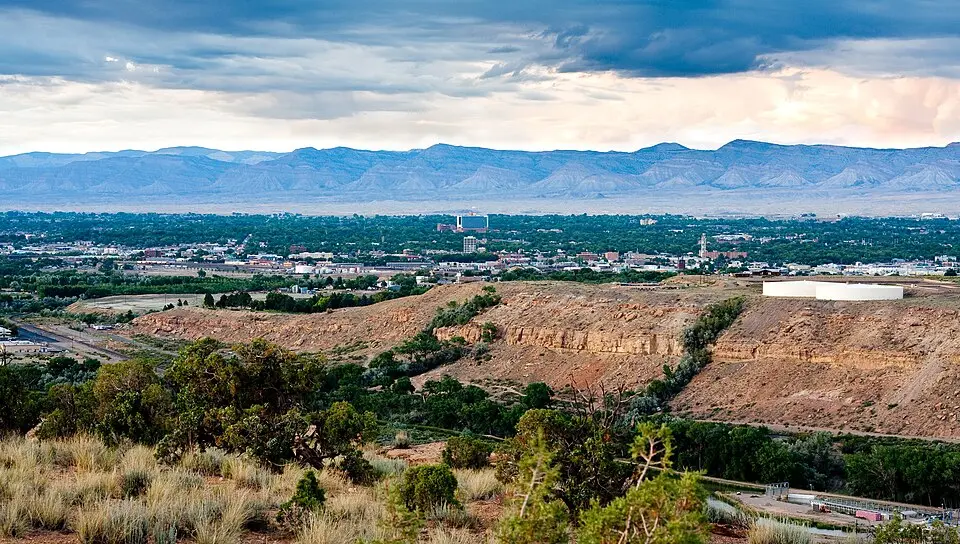
Grand Junction, CO
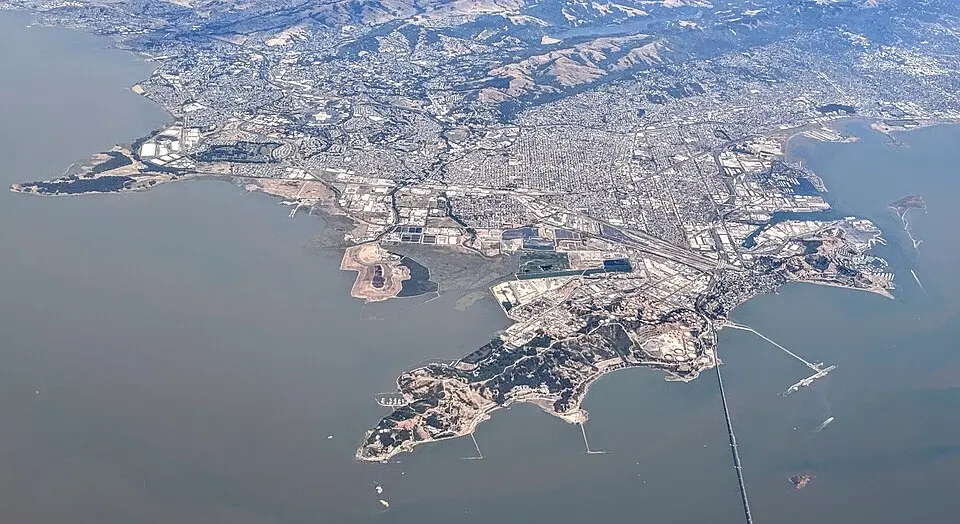
Richmond, CA
Detailed Crime Rate Comparison
| Crime Type | Grand Junction | Richmond | Difference |
|---|---|---|---|
| Total Crime Rate | 3,717.9 | 3,685.5 | +32.4 |
| Violent Crime Rate | 547.5 | 923.1 | -375.6 |
| Murder Rate | 4.2 | 7.9 | -3.7 |
| Rape Rate | 83.5 | 21.2 | +62.3 |
| Robbery Rate | 48.1 | 231.0 | -182.9 |
| Aggravated Assault Rate | 410.3 | 663.0 | -252.8 |
| Property Crime Rate | 3,170.4 | 2,762.4 | +408.0 |
| Burglary Rate | 321.1 | 128.7 | +192.4 |
| Larceny-Theft Rate | 2,624.3 | 1,653.2 | +971.1 |
| Motor Vehicle Theft Rate | 224.9 | 980.4 | -755.5 |
All rates per 100,000 residents. Source: FBI UCR 2024.
Frequently Asked Questions
Is Grand Junction or Richmond safer?
Richmond is safer with a total crime rate of 3,685 per 100K vs 3,718 for Grand Junction — a 1% difference.
How do violent crime rates compare?
Grand Junction has a violent crime rate of 547.5 per 100K while Richmond has 923.1. Grand Junction has lower violent crime.
About Grand Junction, CO
Grand Junction, nestled on the Colorado River, is the largest city on the Western Slope. Known for its peach orchards, it's also home to Colorado Mesa University, attracting a diverse student population. With a safety score of 11/100 and a population coverage of 70,686, Grand Junction has a total crime rate of 3,717.9 per 100,000 residents.
About Richmond, CA
Richmond, California, a Bay Area city with a deep industrial past, was home to a major Kaiser Shipyard during WWII. This diverse city on the San Francisco Bay has a significant Black population, reflecting its wartime boom. With a safety score of 11/100 and a population coverage of 113,418, Richmond has a total crime rate of 3,685.5 per 100,000 residents.