Is Hutchinson or Pittsburg Safer?
According to crimebycity.com's analysis of 2024 FBI data, Hutchinson is safer than Pittsburg (Safety Score 27/100 vs 26/100), with a total crime rate of 2,597 per 100,000 versus 2,609 for Pittsburg — 0% lower. Hutchinson has lower rates in 5 of 7 crime categories.
The biggest difference is in robbery, where Hutchinson has a 87% lower rate.
Hutchinson — 5-Year Trend
 Violent
 Property
Total
Property
Total
Pittsburg — 5-Year Trend
Violent
Property
Total
Hutchinson, KS
Pittsburg, CA
Detailed Crime Rate Comparison
| Crime Type | Hutchinson | Pittsburg | Difference |
|---|---|---|---|
| Total Crime Rate | 2,596.8 | 2,609.1 | -12.2 |
| Violent Crime Rate | 366.6 | 460.2 | -93.6 |
| Murder Rate | 2.5 | 2.6 | -0.1 |
| Rape Rate | 73.3 | 37.0 | +36.3 |
| Robbery Rate | 15.2 | 112.4 | -97.2 |
| Aggravated Assault Rate | 275.6 | 308.1 | -32.5 |
| Property Crime Rate | 2,230.2 | 2,148.9 | +81.3 |
| Burglary Rate | 194.7 | 321.3 | -126.6 |
| Larceny-Theft Rate | 1,868.6 | 1,024.9 | +843.8 |
| Motor Vehicle Theft Rate | 166.9 | 802.7 | -635.8 |
All rates per 100,000 residents. Source: FBI UCR 2024.
Frequently Asked Questions
Is Hutchinson or Pittsburg safer?
Hutchinson is safer with a total crime rate of 2,597 per 100K vs 2,609 for Pittsburg — a 0% difference.
How do violent crime rates compare?
Hutchinson has a violent crime rate of 366.6 per 100K while Pittsburg has 460.2. Hutchinson has lower violent crime.
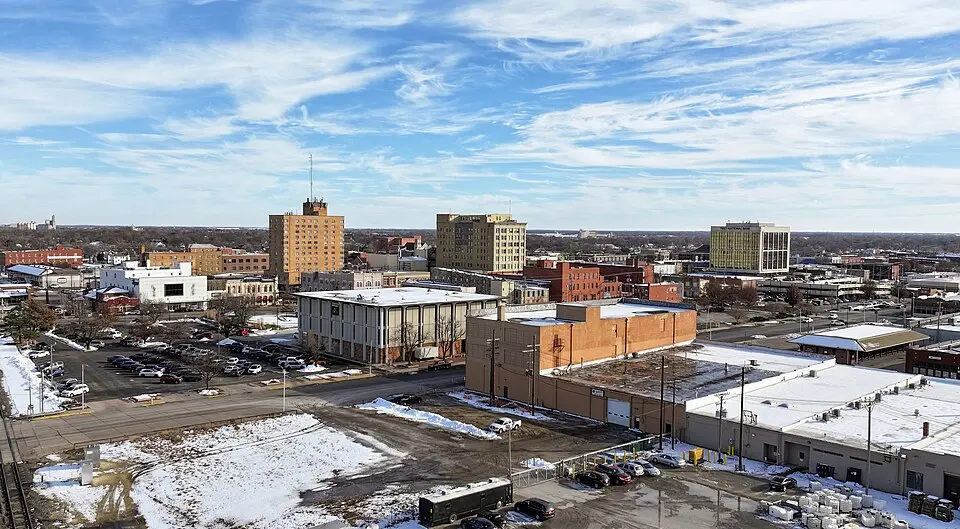
About Hutchinson, KS
Hutchinson, the "Salt City," sits in central Kansas, home to the Kansas State Fair and a population of around 40,000. Its history is deeply tied to the salt deposits beneath the city. With a safety score of 27/100 and a population coverage of 39,548, Hutchinson has a total crime rate of 2,596.8 per 100,000 residents.
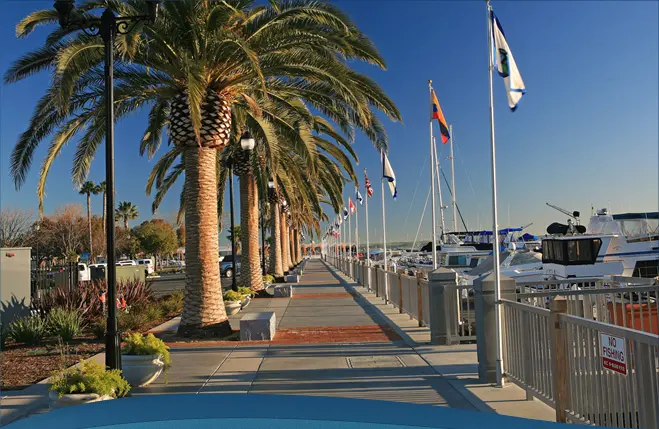
About Pittsburg, CA
Pittsburg, California, once a thriving fishing port, sits on the Sacramento-San Joaquin River Delta. This diverse East Bay city has a population of over 76,000, with a significant Hispanic and Latino presence. With a safety score of 26/100 and a population coverage of 75,621, Pittsburg has a total crime rate of 2,609.1 per 100,000 residents.