Is Lawrence or Ventura Safer?
According to crimebycity.com's analysis of 2024 FBI data, Ventura is safer than Lawrence (Safety Score 26/100 vs 26/100), with a total crime rate of 2,616 per 100,000 versus 2,627 for Lawrence — 0% lower. Lawrence has lower rates in 4 of 7 crime categories.
The biggest difference is in robbery, where Lawrence has a 60% lower rate.
Lawrence — 4-Year Trend
 Violent
Property
Total
Violent
Property
Total
Ventura — 5-Year Trend
Violent
 Property
Total
Property
Total
Lawrence, KS
Ventura, CA
Detailed Crime Rate Comparison
| Crime Type | Lawrence | Ventura | Difference |
|---|---|---|---|
| Total Crime Rate | 2,627.4 | 2,616.5 | +10.9 |
| Violent Crime Rate | 470.8 | 410.9 | +59.9 |
| Murder Rate | 5.2 | 2.8 | +2.4 |
| Rape Rate | 74.5 | 46.1 | +28.5 |
| Robbery Rate | 33.1 | 82.9 | -49.8 |
| Aggravated Assault Rate | 348.7 | 279.2 | +69.6 |
| Property Crime Rate | 2,156.6 | 2,205.6 | -49.0 |
| Burglary Rate | 229.7 | 265.3 | -35.6 |
| Larceny-Theft Rate | 1,762.3 | 1,733.9 | +28.4 |
| Motor Vehicle Theft Rate | 164.5 | 206.4 | -41.8 |
All rates per 100,000 residents. Source: FBI UCR 2024.
Frequently Asked Questions
Is Lawrence or Ventura safer?
Ventura is safer with a total crime rate of 2,616 per 100K vs 2,627 for Lawrence — a 0% difference.
How do violent crime rates compare?
Lawrence has a violent crime rate of 470.8 per 100K while Ventura has 410.9. Ventura has lower violent crime.
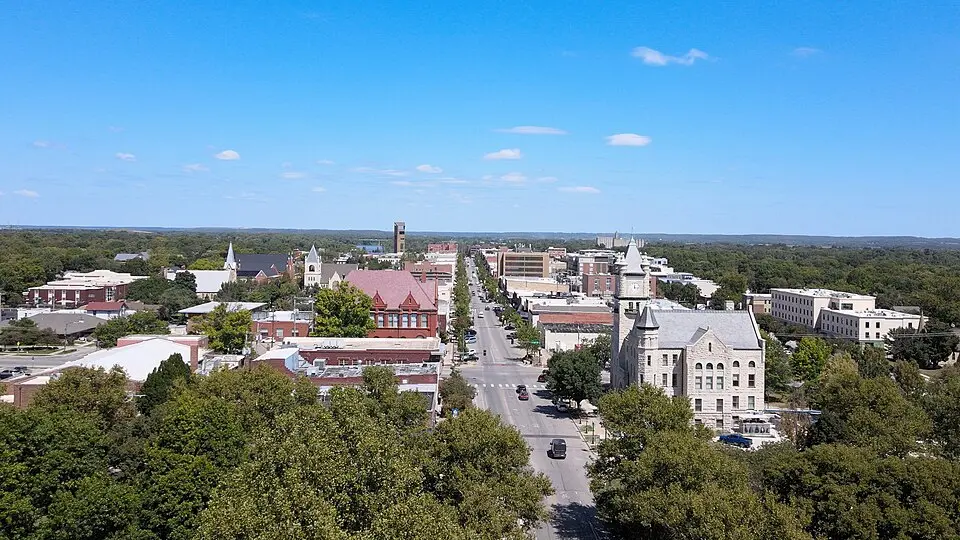
About Lawrence, KS
Lawrence, Kansas, home to the University of Kansas Jayhawks, sits on the Kansas River. This vibrant college town, with a population around 97,000, played a significant role in the Bleeding Kansas era. With a safety score of 26/100 and a population coverage of 96,636, Lawrence has a total crime rate of 2,627.4 per 100,000 residents.
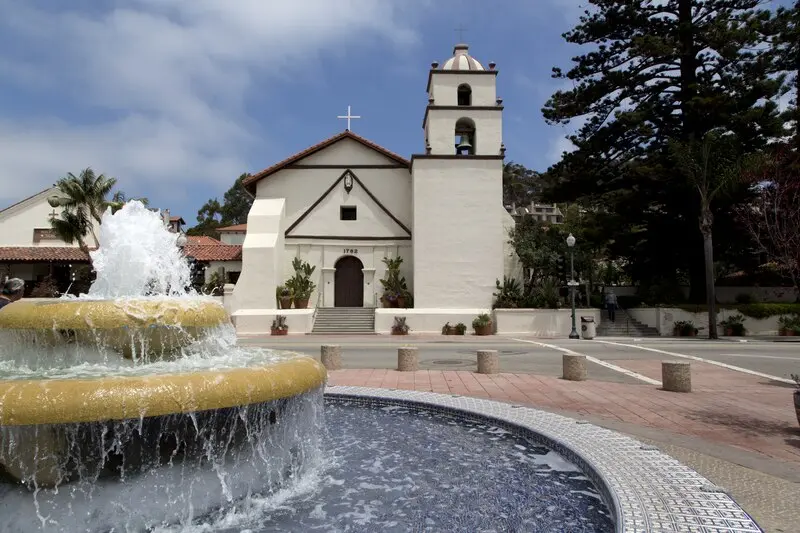
About Ventura, CA
Ventura, a coastal city in Southern California, is known for its historic Mission San Buenaventura, founded in 1782. Its population is approximately 110,000, and it sits along the Pacific Ocean, offering a Mediterranean climate. With a safety score of 26/100 and a population coverage of 108,543, Ventura has a total crime rate of 2,616.5 per 100,000 residents.