Is Leavenworth or Montebello Safer?
According to crimebycity.com's analysis of 2024 FBI data, Leavenworth is safer than Montebello (Safety Score 18/100 vs 18/100), with a total crime rate of 3,083 per 100,000 versus 3,108 for Montebello — 1% lower. Leavenworth has lower rates in 4 of 7 crime categories.
The biggest difference is in murder, where Leavenworth has a 100% lower rate.
Leavenworth — 5-Year Trend
 Violent
 Property
Total
Property
Total
Montebello — 5-Year Trend
Violent
Property
Total
Leavenworth, KS
Montebello, CA
Detailed Crime Rate Comparison
| Crime Type | Leavenworth | Montebello | Difference |
|---|---|---|---|
| Total Crime Rate | 3,083.5 | 3,108.2 | -24.7 |
| Violent Crime Rate | 495.4 | 494.7 | +0.7 |
| Murder Rate | 0.0 | 3.4 | -3.4 |
| Rape Rate | 46.0 | 23.6 | +22.4 |
| Robbery Rate | 51.4 | 133.4 | -81.9 |
| Aggravated Assault Rate | 398.0 | 334.3 | +63.7 |
| Property Crime Rate | 2,588.1 | 2,613.5 | -25.4 |
| Burglary Rate | 446.7 | 312.3 | +134.3 |
| Larceny-Theft Rate | 1,970.8 | 1,475.6 | +495.2 |
| Motor Vehicle Theft Rate | 170.6 | 825.6 | -655.0 |
All rates per 100,000 residents. Source: FBI UCR 2024.
Frequently Asked Questions
Is Leavenworth or Montebello safer?
Leavenworth is safer with a total crime rate of 3,083 per 100K vs 3,108 for Montebello — a 1% difference.
How do violent crime rates compare?
Leavenworth has a violent crime rate of 495.4 per 100K while Montebello has 494.7. Montebello has lower violent crime.
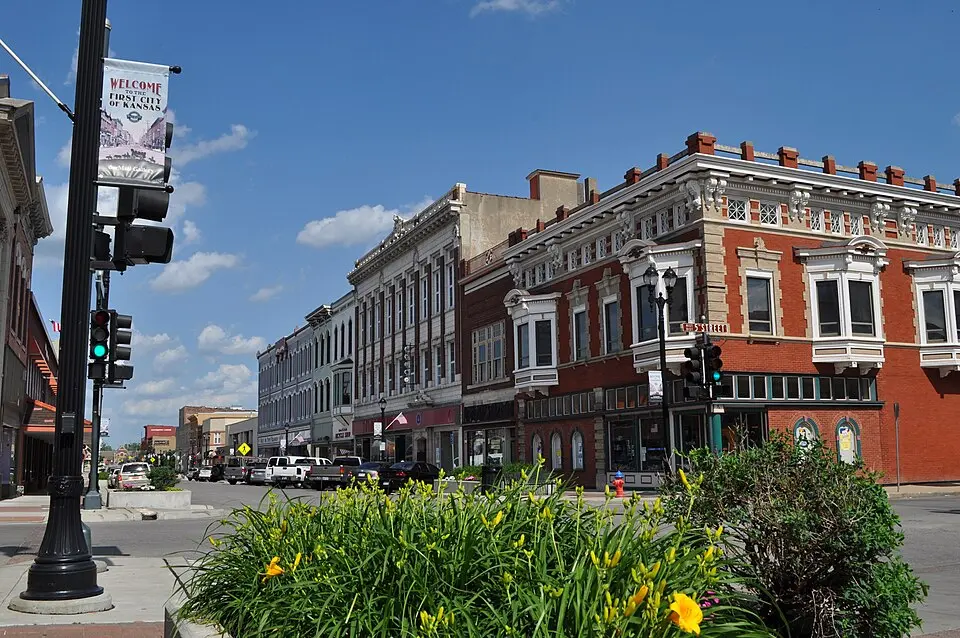
About Leavenworth, KS
Leavenworth, Kansas, is a historic city on the Missouri River, known as the "First City of Kansas." It's home to Fort Leavenworth, the oldest continuously active Army post west of Washington D.C., and a diverse population of approximately 37,000 residents. With a safety score of 18/100 and a population coverage of 36,939, Leavenworth has a total crime rate of 3,083.5 per 100,000 residents.
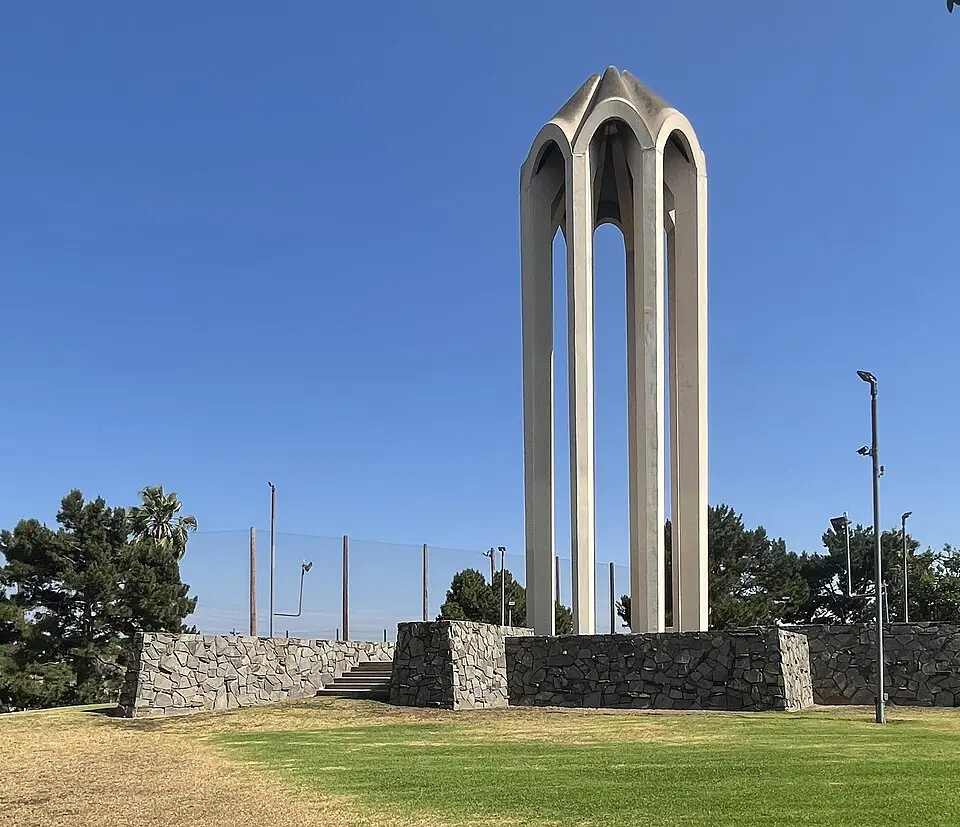
About Montebello, CA
Montebello, once home to the first telegraph station in Southern California, is a suburban city in Los Angeles County. It's known for its diverse population, with a significant Hispanic and Asian presence. With a safety score of 18/100 and a population coverage of 59,231, Montebello has a total crime rate of 3,108.2 per 100,000 residents.