Moving from Lowell, MA to Swampscott, MA?
The Moving Checklist Planner turns your move-in date into a dated checklist, packing inventory and budget — seven tabs for Google Sheets or Excel, $12 once.
Is Lowell, MA or Swampscott, MA Safer?
According to crimebycity.com's analysis of FBI data, Swampscott, MA is safer than Lowell, MA (Safety Score 68/100 vs 35/100), with a total crime rate of 1,157 per 100,000 versus 2,195 for Lowell, MA — 47% lower. Lowell has higher rates in 0 of 7 crime categories.
The biggest difference is in murder, where Swampscott has a 100% lower rate.
Note: Lowell is 7.3x larger by coverage, which can affect crime rate comparisons. Larger cities tend to report higher rates due to density and more comprehensive reporting.
Quiz: which of these is SAFER than Lowell, MA?
Lowell — 5-Year Trend
 Violent
Property
Total
Swampscott — 5-Year Trend
Violent
Property
Total
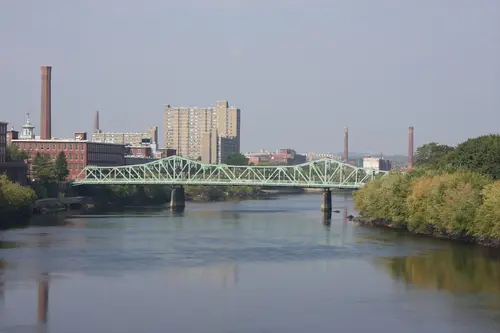
Lowell, MA
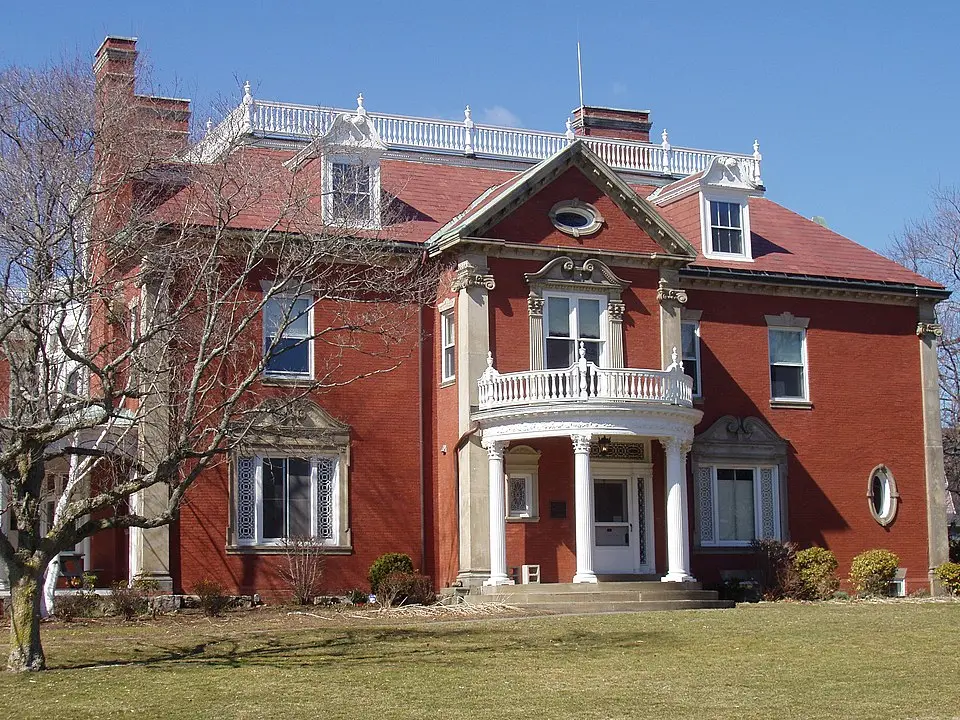
Swampscott, MA
Detailed Crime Rate Comparison
| Crime Type | Lowell | Swampscott | Difference |
|---|---|---|---|
| Total Crime Rate | 2,195.4 | 1,156.7 | +1,038.7 |
| Violent Crime Rate | 532.5 | 81.7 | +450.7 |
| Murder Rate | 4.3 | 0.0 | +4.3 |
| Rape Rate | 6.9 | 6.3 | +0.6 |
| Robbery Rate | 56.9 | 6.3 | +50.6 |
| Aggravated Assault Rate | 464.4 | 69.2 | +395.3 |
| Property Crime Rate | 1,662.9 | 1,075.0 | +587.9 |
| Burglary Rate | 149.9 | 119.4 | +30.5 |
| Larceny-Theft Rate | 1,309.6 | 911.6 | +398.1 |
| Motor Vehicle Theft Rate | 203.3 | 44.0 | +159.3 |
All rates per 100,000 residents. Source: FBI UCR.
Moving from Lowell, MA to Swampscott, MA?
The Moving Checklist Planner turns your move-in date into a dated checklist, packing inventory and budget — seven tabs for Google Sheets or Excel, $12 once.
Frequently Asked Questions
Is Lowell or Swampscott safer?
Swampscott, MA is safer with a total crime rate of 1,157 per 100K vs 2,195 for Lowell, MA — a 47% difference.
How do violent crime rates compare?
Lowell has a violent crime rate of 532.5 per 100K while Swampscott has 81.7. Swampscott has lower violent crime.
About Lowell, MA
Lowell, a historic mill city on the Merrimack River, was a birthplace of the American Industrial Revolution. Its diverse population includes a significant Cambodian American community. With a safety score of 35/100 and a population coverage of 116,062, Lowell has a total crime rate of 2,195.4 per 100,000 residents.
About Swampscott, MA
Swampscott, a coastal town north of Boston, boasts a rich history as the birthplace of the modern lobster industry. Its scenic shoreline, with beaches and rocky outcrops, defines much of the affluent community. With a safety score of 68/100 and a population coverage of 15,907, Swampscott has a total crime rate of 1,156.7 per 100,000 residents.