Moving from Manchester, NH to Philadelphia, PA?
An out-of-state move adds a new driver's license, plates, voter registration and state-specific deadlines. The Moving Checklist Planner dates every task from your move-in day — seven tabs for Google Sheets or Excel, $12 once.
Is Manchester, NH or Philadelphia, PA Safer?
According to crimebycity.com's analysis of FBI data, Manchester, NH is safer than Philadelphia, PA (Safety Score 41/100 vs 3/100), with a total crime rate of 1,985 per 100,000 versus 5,458 for Philadelphia, PA — 64% lower. Manchester has lower rates in 7 of 7 crime categories.
The biggest difference is in murder, where Manchester has a 90% lower rate.
Note: Philadelphia is 13.4x larger by coverage, which can affect crime rate comparisons. Larger cities tend to report higher rates due to density and more comprehensive reporting.
Quiz: which of these is SAFER than Manchester, NH?
Manchester — 5-Year Trend
 Violent
Property
Total
Philadelphia — 4-Year Trend
Violent
 Property
Total
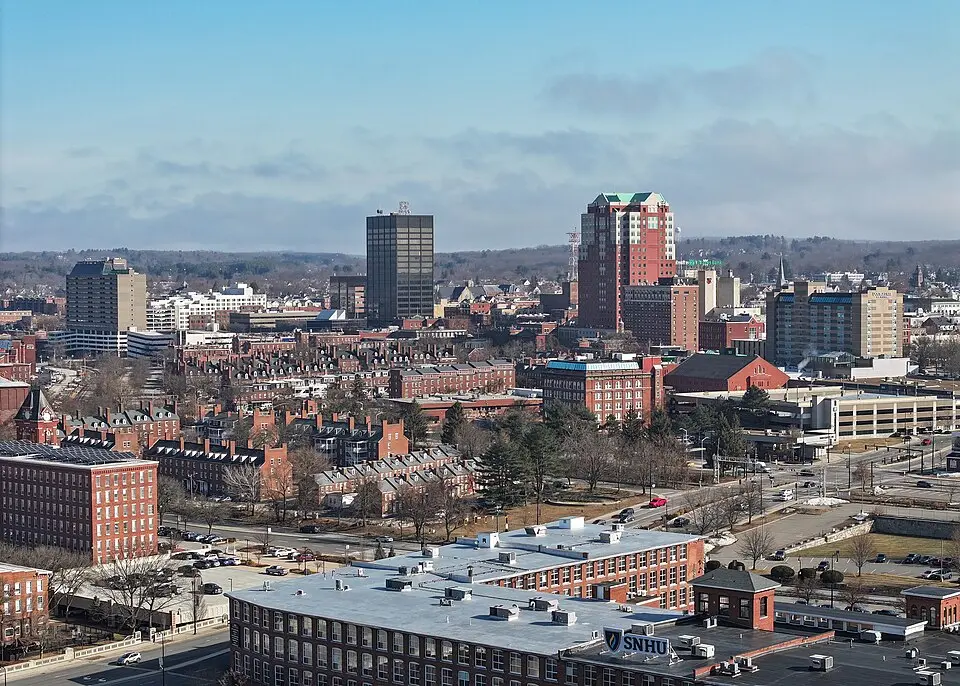
Manchester, NH
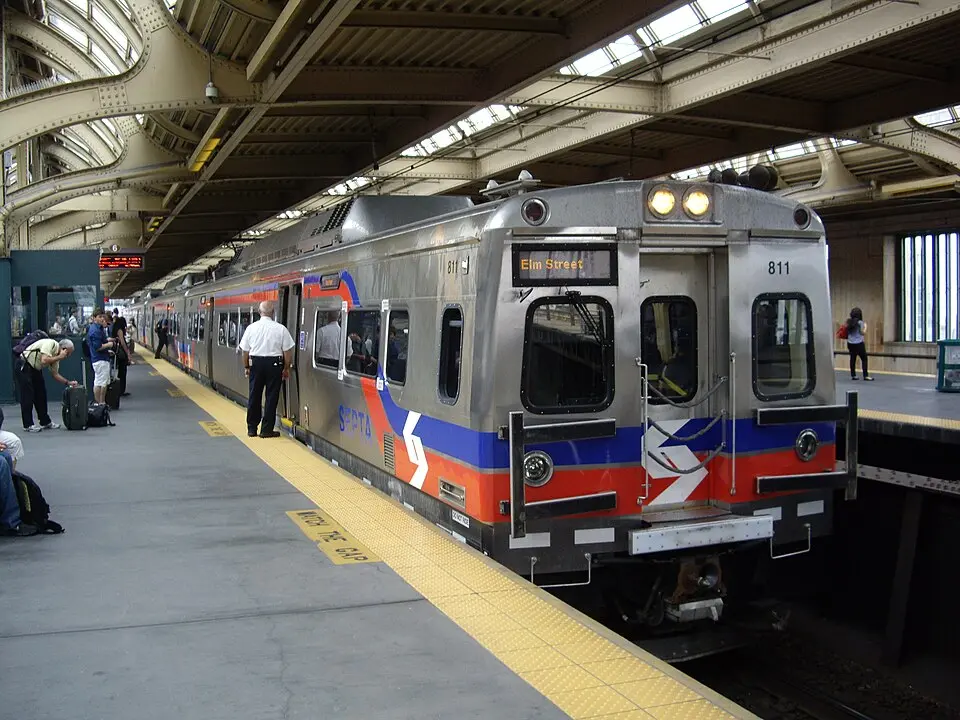
Philadelphia, PA
Detailed Crime Rate Comparison
| Crime Type | Manchester | Philadelphia | Difference |
|---|---|---|---|
| Total Crime Rate | 1,985.0 | 5,458.5 | -3,473.5 |
| Violent Crime Rate | 336.9 | 910.3 | -573.4 |
| Murder Rate | 1.7 | 16.9 | -15.2 |
| Rape Rate | 52.0 | 46.1 | +5.9 |
| Robbery Rate | 58.0 | 273.2 | -215.2 |
| Aggravated Assault Rate | 224.3 | 572.5 | -348.2 |
| Property Crime Rate | 1,648.1 | 4,548.2 | -2,900.0 |
| Burglary Rate | 92.7 | 319.0 | -226.3 |
| Larceny-Theft Rate | 1,404.8 | 3,223.6 | -1,818.8 |
| Motor Vehicle Theft Rate | 150.7 | 1,005.6 | -854.9 |
All rates per 100,000 residents. Source: FBI UCR.
Moving from Manchester, NH to Philadelphia, PA?
An out-of-state move adds new driver's license, plates, voter registration and deadlines that differ by state. The Moving Checklist Planner dates every task from your move-in day — seven tabs for Google Sheets or Excel, $12 once.
Frequently Asked Questions
Is Manchester or Philadelphia safer?
Manchester, NH is safer with a total crime rate of 1,985 per 100K vs 5,458 for Philadelphia, PA — a 64% difference.
How do violent crime rates compare?
Manchester has a violent crime rate of 336.9 per 100K while Philadelphia has 910.3. Manchester has lower violent crime.
About Manchester, NH
Manchester, once a mill town powered by the Merrimack River, is New Hampshire's largest city. Its historic Amoskeag Millyard now houses businesses and a university, reflecting a shift towards a service-based economy. With a safety score of 41/100 and a population coverage of 115,464, Manchester has a total crime rate of 1,985.0 per 100,000 residents.
About Philadelphia, PA
Philadelphia, the birthplace of American independence, is Pennsylvania's largest city. Situated along the Delaware River, its diverse population contributes to a rich urban tapestry. With a safety score of 3/100 and a population coverage of 1,549,259, Philadelphia has a total crime rate of 5,458.5 per 100,000 residents.