Is Oakland or Tacoma Safer?
According to crimebycity.com's analysis of 2024 FBI data, Tacoma is safer than Oakland (Safety Score 1/100 vs 1/100), with a total crime rate of 6,667 per 100,000 versus 9,156 for Oakland — 27% lower. Oakland has higher rates in 0 of 7 crime categories.
The biggest difference is in robbery, where Tacoma has a 73% lower rate.
Oakland — 5-Year Trend
 Violent
Property
Total
Violent
Property
Total
Tacoma — 5-Year Trend
Violent
Property
Total
Oakland, CA
Tacoma, WA
Detailed Crime Rate Comparison
| Crime Type | Oakland | Tacoma | Difference |
|---|---|---|---|
| Total Crime Rate | 9,155.7 | 6,666.7 | +2,489.0 |
| Violent Crime Rate | 1,925.3 | 1,063.0 | +862.3 |
| Murder Rate | 18.6 | 9.8 | +8.8 |
| Rape Rate | 68.0 | 67.9 | +0.2 |
| Robbery Rate | 680.4 | 184.4 | +496.0 |
| Aggravated Assault Rate | 1,158.3 | 801.0 | +357.3 |
| Property Crime Rate | 7,230.3 | 5,603.6 | +1,626.7 |
| Burglary Rate | 786.8 | 669.7 | +117.1 |
| Larceny-Theft Rate | 4,164.7 | 3,521.3 | +643.4 |
| Motor Vehicle Theft Rate | 2,278.9 | 1,412.6 | +866.2 |
All rates per 100,000 residents. Source: FBI UCR 2024.
Frequently Asked Questions
Is Oakland or Tacoma safer?
Tacoma is safer with a total crime rate of 6,667 per 100K vs 9,156 for Oakland — a 27% difference.
How do violent crime rates compare?
Oakland has a violent crime rate of 1,925.3 per 100K while Tacoma has 1,063.0. Tacoma has lower violent crime.
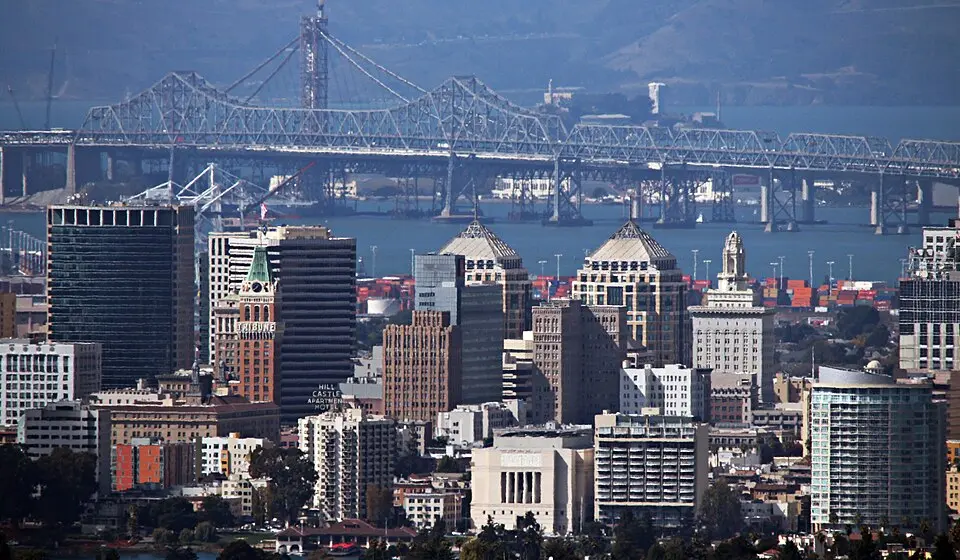
About Oakland, CA
Oakland, a diverse East Bay city, boasts a rich history of activism and art, including its vibrant jazz scene. Geographically, it sits on the San Francisco Bay's eastern shore, home to a significant port and varied topography. With a safety score of 1/100 and a population coverage of 435,042, Oakland has a total crime rate of 9,155.7 per 100,000 residents.
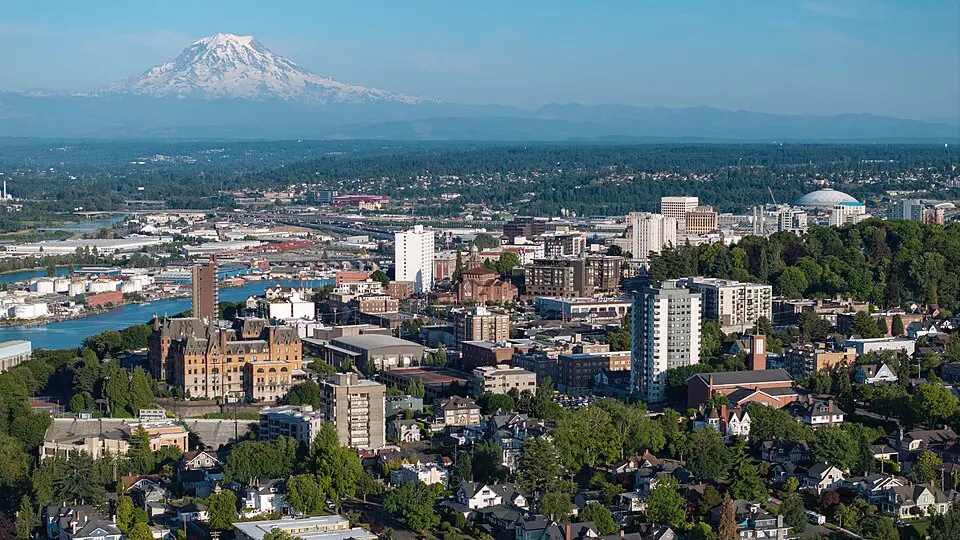
About Tacoma, WA
Tacoma, nestled on Commencement Bay, boasts a rich industrial past, once a major port for timber and rail. Today, this diverse city, home to over 200,000 residents, features a vibrant arts scene and stunning views of Mount Rainier. With a safety score of 1/100 and a population coverage of 223,980, Tacoma has a total crime rate of 6,666.7 per 100,000 residents.