Is Portsmouth or St. Joseph Safer?
According to crimebycity.com's analysis of 2024 FBI data, St. Joseph is safer than Portsmouth (Safety Score 5/100 vs 5/100), with a total crime rate of 4,579 per 100,000 versus 4,613 for Portsmouth — 1% lower. Portsmouth has higher rates in 2 of 7 crime categories.
The biggest difference is in murder, where St. Joseph has a 88% lower rate.
Portsmouth — 5-Year Trend
 Violent
Property
Total
Violent
Property
Total
St. Joseph — 5-Year Trend
 Violent
Property
Total
Violent
Property
Total
Portsmouth, VA
St. Joseph, MO
Detailed Crime Rate Comparison
| Crime Type | Portsmouth | St. Joseph | Difference |
|---|---|---|---|
| Total Crime Rate | 4,613.2 | 4,579.5 | +33.7 |
| Violent Crime Rate | 752.4 | 728.6 | +23.9 |
| Murder Rate | 37.1 | 4.3 | +32.8 |
| Rape Rate | 36.0 | 178.2 | -142.2 |
| Robbery Rate | 167.8 | 54.2 | +113.6 |
| Aggravated Assault Rate | 511.6 | 491.9 | +19.7 |
| Property Crime Rate | 3,860.8 | 3,850.9 | +9.9 |
| Burglary Rate | 424.1 | 536.1 | -112.0 |
| Larceny-Theft Rate | 2,920.1 | 2,774.5 | +145.6 |
| Motor Vehicle Theft Rate | 516.7 | 540.4 | -23.7 |
All rates per 100,000 residents. Source: FBI UCR 2024.
Frequently Asked Questions
Is Portsmouth or St. Joseph safer?
St. Joseph is safer with a total crime rate of 4,579 per 100K vs 4,613 for Portsmouth — a 1% difference.
How do violent crime rates compare?
Portsmouth has a violent crime rate of 752.4 per 100K while St. Joseph has 728.6. St. Joseph has lower violent crime.
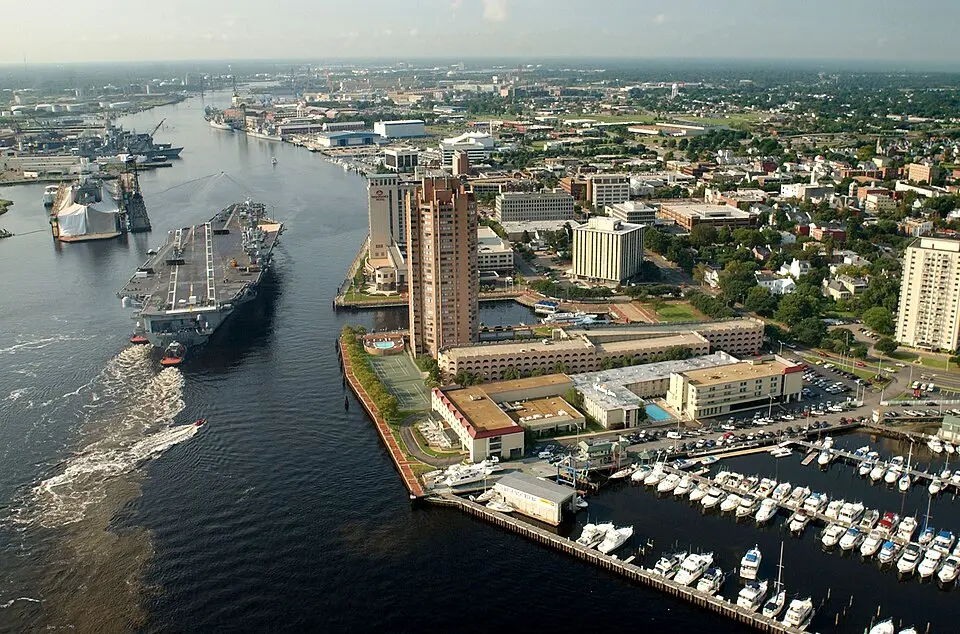
About Portsmouth, VA
Portsmouth, Virginia, established in 1752, sits across the Elizabeth River from Norfolk. Home to the historic Gosport Shipyard, it's a diverse city with a significant African American population. With a safety score of 5/100 and a population coverage of 97,156, Portsmouth has a total crime rate of 4,613.2 per 100,000 residents.
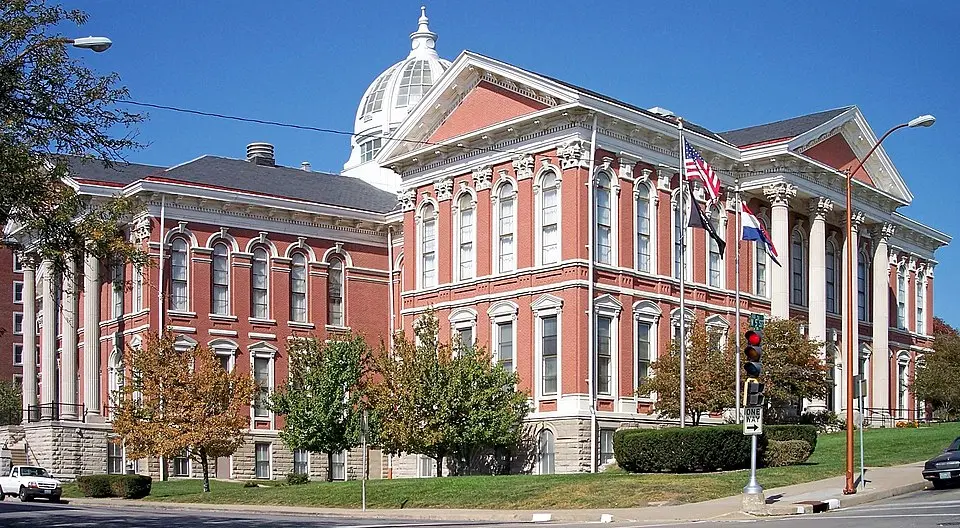
About St. Joseph, MO
St. Joseph, Missouri, a city on the Missouri River, was the starting point of the Pony Express. This Buchanan County seat is located across from Kansas. With a safety score of 5/100 and a population coverage of 70,139, St. Joseph has a total crime rate of 4,579.5 per 100,000 residents.