 Violent
Property
Total
Violent
Property
Total
Quick answer
According to crimebycity.com's analysis of FBI 2024 crime data, Canton, MA has a Safety Score of 80/100 — safer than 80% of US cities — with a total crime rate of 830.0 per 100,000 residents, ranking #587 of 2,971 US cities and #83 of 186 in Massachusetts.
Safety Score
Violent Crime Rate
Property Crime Rate
Is Canton, Massachusetts Safe?
Canton, Massachusetts, a town in Norfolk County, is home to the Museum of American Bird Art at Mass Audubon. It is situated approximately 15 miles southwest of Boston.
Canton has a safety score of 80/100 (Safer Than Average). Based on FBI data for 2024, the city reported a total crime rate of 830.0 per 100,000 residents, compared to the national average of 2,752.3 per 100,000.
Canton ranks #83 out of 186 cities in Massachusetts and #587 out of 2971 nationally (safest first). This places it in the 80th percentile for safety — safer than 80% of US cities.
Year over year, Canton's total crime rate decreased by 21.2%, with violent crime declining 24.9%.
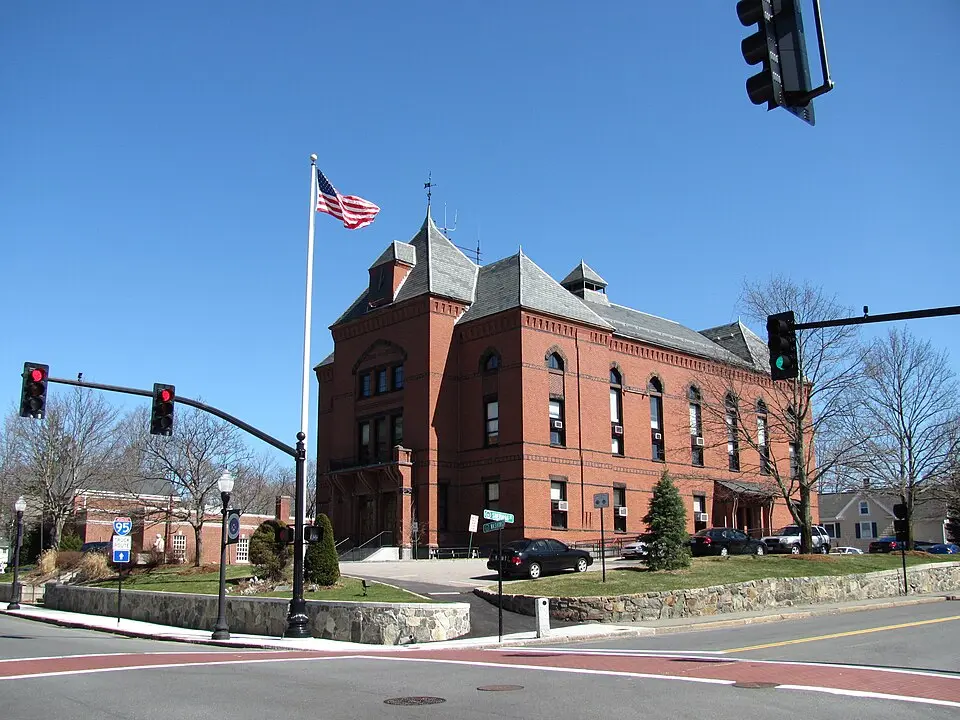
Photo: Wikimedia Commons
Canton Crime Statistics Breakdown (2024)
| Crime Type | Incidents | Rate per 100K | National Avg |
|---|---|---|---|
| Violent Crime | 73 | 289.9 | 473.3 |
| Murder | 0 | 0.0 | 6.2 |
| Rape | 2 | 7.9 | 43.4 |
| Robbery | 4 | 15.9 | 93.0 |
| Aggravated Assault | 67 | 266.1 | 330.0 |
| Property Crime | 136 | 540.1 | 2,279.1 |
| Burglary | 10 | 39.7 | 287.8 |
| Larceny-Theft | 112 | 444.8 | 1,638.9 |
| Motor Vehicle Theft | 14 | 55.6 | 352.4 |
| Arson | 0 | 0.0 | 0.0 |
Canton vs Massachusetts Average
How does Canton's crime rate compare to the Massachusetts state average?
| Metric | Canton | Massachusetts Avg | Difference |
|---|---|---|---|
| Violent Crime Rate | 289.9 | 312.0 | -7.1% |
| Property Crime Rate | 540.1 | 1,086.7 | -50.3% |
| Murder Rate | 0.0 | 2.0 | -100.0% |
| Total Crime Rate | 830.0 | 1,398.7 | -40.7% |
Canton Crime Rate Trends
Year-over-year crime rate changes for Canton, Massachusetts.
| Year | Coverage | Total Crime Rate | Violent Crime Rate | Property Crime Rate |
|---|---|---|---|---|
| 2024 | 25,181 | 830.0 | 289.9 | 540.1 |
| 2023 | 24,864 | 1,053.7 | 386.1 | 667.6 |
| 2022 | 24,717 | 1,088.3 | 400.5 | 687.8 |
| 2021 | 24,570 | 879.1 | 305.3 | 573.9 |
| 2020 | 24,015 | 895.3 | 308.1 | 587.1 |
| 2019 | 23,706 | 1,020.8 | 358.6 | 662.3 |
Frequently Asked Questions
Is Canton, Massachusetts safe?
Canton has a safety score of 80/100, meaning it has less crime than about 80% of US cities in our FBI dataset. With a total crime rate of 830.0 per 100,000 residents in 2024, Canton is relatively safe.
What is the crime rate in Canton, Massachusetts?
According to FBI data for 2024, Canton has a violent crime rate of 289.9 per 100,000 and a property crime rate of 540.1 per 100,000 residents.
How does Canton compare to the national average?
Canton's total crime rate of 830.0 per 100,000 can be compared to the national average. The data covers 25,181 residents.
What types of crime are most common in Canton?
Based on FBI 2024 data, the most reported crimes in Canton include larceny-theft, aggravated assault, and burglary. Property crime is generally more common than violent crime.
Is Canton safe to visit?
Like any city, Canton has areas that are safer than others. The city's overall safety score is 80/100 based on FBI crime data. Standard travel precautions are recommended.