 Violent
 Property
 Total
Total
Quick answer
According to crimebycity.com's analysis of FBI 2024 crime data, Charlton, MA has a Safety Score of 94/100 — safer than 94% of US cities — with a total crime rate of 453.5 per 100,000 residents, ranking #194 of 2,971 US cities and #38 of 186 in Massachusetts.
Safety Score
Violent Crime Rate
Property Crime Rate
Is Charlton, Massachusetts Safe?
Charlton, Massachusetts, a rural town in Worcester County, is home to a portion of the historic Old Sturbridge Village. Its forested landscape and low population density define much of its character.
Charlton has a safety score of 94/100 (Safer Than Average). Based on FBI data for 2024, the city reported a total crime rate of 453.5 per 100,000 residents, compared to the national average of 2,752.3 per 100,000.
Charlton ranks #38 out of 186 cities in Massachusetts and #194 out of 2971 nationally (safest first). This places it in the 94th percentile for safety — safer than 94% of US cities.
All major crime categories in Charlton are below the national average, with murder particularly low at 0.0x the national rate.
Year over year, Charlton's total crime rate decreased by 51.3%, with violent crime rising 96.5%.
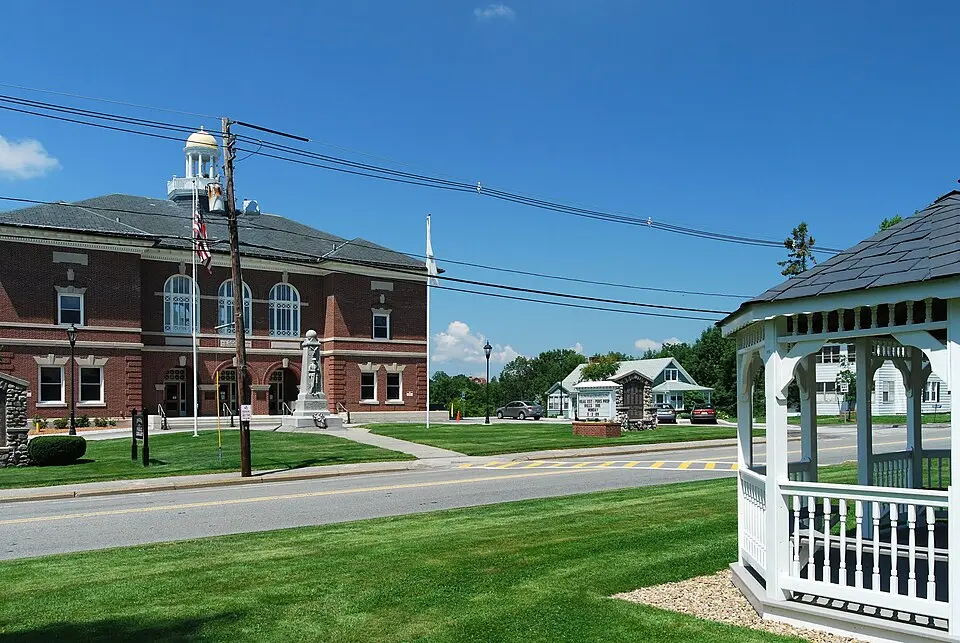
Photo: Wikimedia Commons
Charlton Crime Statistics Breakdown (2024)
| Crime Type | Incidents | Rate per 100K | National Avg |
|---|---|---|---|
| Violent Crime | 16 | 117.0 | 473.3 |
| Murder | 0 | 0.0 | 6.2 |
| Rape | 2 | 14.6 | 43.4 |
| Robbery | 0 | 0.0 | 93.0 |
| Aggravated Assault | 14 | 102.4 | 330.0 |
| Property Crime | 46 | 336.5 | 2,279.1 |
| Burglary | 8 | 58.5 | 287.8 |
| Larceny-Theft | 30 | 219.4 | 1,638.9 |
| Motor Vehicle Theft | 8 | 58.5 | 352.4 |
| Arson | 0 | 0.0 | 0.0 |
Charlton vs Massachusetts Average
How does Charlton's crime rate compare to the Massachusetts state average?
| Metric | Charlton | Massachusetts Avg | Difference |
|---|---|---|---|
| Violent Crime Rate | 117.0 | 312.0 | -62.5% |
| Property Crime Rate | 336.5 | 1,086.7 | -69.0% |
| Murder Rate | 0.0 | 2.0 | -100.0% |
| Total Crime Rate | 453.5 | 1,398.7 | -67.6% |
Charlton Crime Rate Trends
Year-over-year crime rate changes for Charlton, Massachusetts.
| Year | Coverage | Total Crime Rate | Violent Crime Rate | Property Crime Rate |
|---|---|---|---|---|
| 2024 | 13,672 | 453.5 | 117.0 | 336.5 |
| 2023 | 13,434 | 930.5 | 59.6 | 870.9 |
| 2022 | 13,394 | 507.7 | 82.1 | 425.6 |
| 2021 | 13,881 | 331.4 | 57.6 | 273.8 |
| 2020 | 13,720 | 371.7 | 51.0 | 320.7 |
| 2019 | 13,679 | 460.6 | 58.5 | 402.1 |
Frequently Asked Questions
Is Charlton, Massachusetts safe?
Charlton has a safety score of 94/100, meaning it has less crime than about 94% of US cities in our FBI dataset. With a total crime rate of 453.5 per 100,000 residents in 2024, Charlton is relatively safe.
What is the crime rate in Charlton, Massachusetts?
According to FBI data for 2024, Charlton has a violent crime rate of 117.0 per 100,000 and a property crime rate of 336.5 per 100,000 residents.
How does Charlton compare to the national average?
Charlton's total crime rate of 453.5 per 100,000 can be compared to the national average. The data covers 13,672 residents.
What types of crime are most common in Charlton?
Based on FBI 2024 data, the most reported crimes in Charlton include larceny-theft, aggravated assault, and burglary. Property crime is generally more common than violent crime.
Is Charlton safe to visit?
Like any city, Charlton has areas that are safer than others. The city's overall safety score is 94/100 based on FBI crime data. Standard travel precautions are recommended.