 Violent
 Property
Total
Property
Total
Quick answer
According to crimebycity.com's analysis of FBI 2024 crime data, Malden, MA has a Safety Score of 57/100 — safer than 57% of US cities — with a total crime rate of 1,471.7 per 100,000 residents, ranking #1,270 of 2,971 US cities and #150 of 186 in Massachusetts.
Safety Score
Violent Crime Rate
Property Crime Rate
Is Malden, Massachusetts Safe?
Malden, a diverse city north of Boston, boasts a rich history as home to the first public high school in the United States. Its dense population and urban feel contribute to a dynamic community with varied socioeconomic backgrounds.
Malden has a safety score of 57/100 (Near National Average). Based on FBI data for 2024, the city reported a total crime rate of 1,471.7 per 100,000 residents, compared to the national average of 2,752.3 per 100,000.
Malden ranks #150 out of 186 cities in Massachusetts and #1270 out of 2971 nationally (safest first). This places it in the 57th percentile for safety — safer than 57% of US cities.
All major crime categories in Malden are below the national average, with murder particularly low at 0.0x the national rate.
Year over year, Malden's total crime rate decreased by 12.2%, with violent crime rising 9.9%.
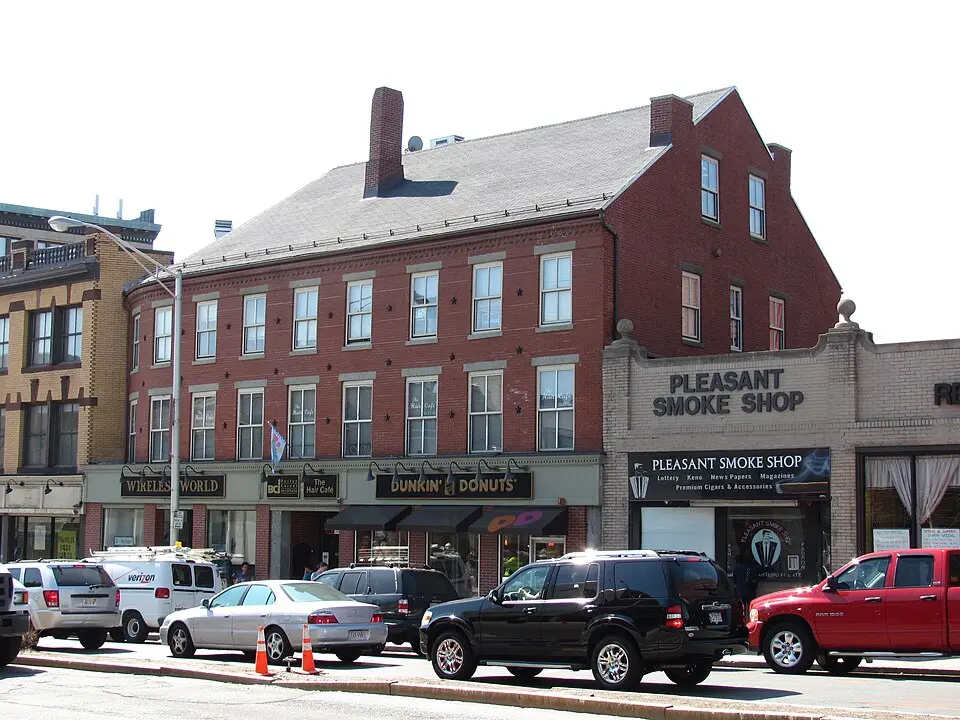
Photo: Wikimedia Commons
Malden Crime Statistics Breakdown (2024)
| Crime Type | Incidents | Rate per 100K | National Avg |
|---|---|---|---|
| Violent Crime | 193 | 292.2 | 473.3 |
| Murder | 0 | 0.0 | 6.2 |
| Rape | 10 | 15.1 | 43.4 |
| Robbery | 26 | 39.4 | 93.0 |
| Aggravated Assault | 157 | 237.7 | 330.0 |
| Property Crime | 779 | 1,179.5 | 2,279.1 |
| Burglary | 80 | 121.1 | 287.8 |
| Larceny-Theft | 587 | 888.8 | 1,638.9 |
| Motor Vehicle Theft | 112 | 169.6 | 352.4 |
| Arson | 0 | 0.0 | 0.0 |
Malden vs Massachusetts Average
How does Malden's crime rate compare to the Massachusetts state average?
| Metric | Malden | Massachusetts Avg | Difference |
|---|---|---|---|
| Violent Crime Rate | 292.2 | 312.0 | -6.3% |
| Property Crime Rate | 1,179.5 | 1,086.7 | +8.5% |
| Murder Rate | 0.0 | 2.0 | -100.0% |
| Total Crime Rate | 1,471.7 | 1,398.7 | +5.2% |
Malden Crime Rate Trends
Year-over-year crime rate changes for Malden, Massachusetts.
| Year | Coverage | Total Crime Rate | Violent Crime Rate | Property Crime Rate |
|---|---|---|---|---|
| 2024 | 66,046 | 1,471.7 | 292.2 | 1,179.5 |
| 2023 | 64,291 | 1,676.8 | 266.0 | 1,410.8 |
| 2022 | 64,356 | 1,480.8 | 233.1 | 1,247.8 |
| 2021 | 60,433 | 1,439.6 | 256.5 | 1,183.1 |
| 2020 | 60,231 | 1,517.5 | 269.0 | 1,248.5 |
| 2019 | 60,746 | 1,450.3 | 266.7 | 1,183.6 |
Frequently Asked Questions
Is Malden, Massachusetts safe?
Malden has a safety score of 57/100, meaning it has less crime than about 57% of US cities in our FBI dataset. With a total crime rate of 1,471.7 per 100,000 residents in 2024, Malden is about average for a US city.
What is the crime rate in Malden, Massachusetts?
According to FBI data for 2024, Malden has a violent crime rate of 292.2 per 100,000 and a property crime rate of 1,179.5 per 100,000 residents.
How does Malden compare to the national average?
Malden's total crime rate of 1,471.7 per 100,000 can be compared to the national average. The data covers 66,046 residents.
What types of crime are most common in Malden?
Based on FBI 2024 data, the most reported crimes in Malden include larceny-theft, aggravated assault, and burglary. Property crime is generally more common than violent crime.
Is Malden safe to visit?
Like any city, Malden has areas that are safer than others. The city's overall safety score is 57/100 based on FBI crime data. Standard travel precautions are recommended.