 Violent
 Property
Total
Property
Total
Quick answer
According to crimebycity.com's analysis of FBI 2024 crime data, Marlboro, MA has a Safety Score of 58/100 — safer than 58% of US cities — with a total crime rate of 1,457.5 per 100,000 residents, ranking #1,256 of 2,971 US cities and #149 of 186 in Massachusetts.
Safety Score
Violent Crime Rate
Property Crime Rate
Is Marlboro, Massachusetts Safe?
Marlborough, Massachusetts, once home to a vibrant shoe industry, now boasts a diverse population of over 40,000. Located in Middlesex County, it sits at the crossroads of major routes, providing easy access to Boston and Worcester.
Marlboro has a safety score of 58/100 (Near National Average). Based on FBI data for 2024, the city reported a total crime rate of 1,457.5 per 100,000 residents, compared to the national average of 2,752.3 per 100,000.
Marlboro ranks #149 out of 186 cities in Massachusetts and #1256 out of 2971 nationally (safest first). This places it in the 58th percentile for safety — safer than 58% of US cities.
Year over year, Marlboro's total crime rate decreased by 6.4%, with violent crime rising 15.3%.
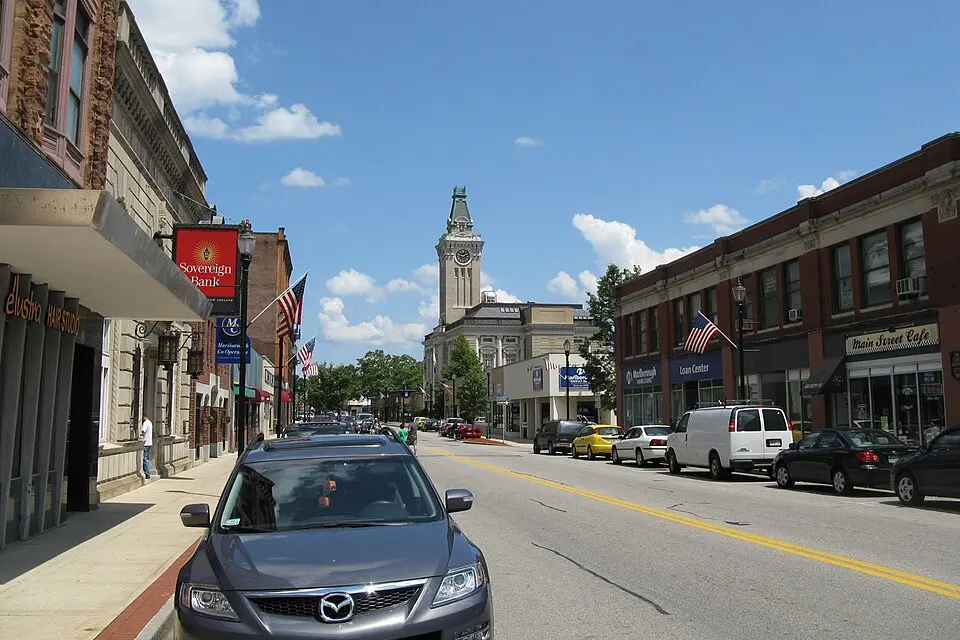
Photo: Wikimedia Commons
Marlboro Crime Statistics Breakdown (2024)
| Crime Type | Incidents | Rate per 100K | National Avg |
|---|---|---|---|
| Violent Crime | 176 | 421.2 | 473.3 |
| Murder | 0 | 0.0 | 6.2 |
| Rape | 19 | 45.5 | 43.4 |
| Robbery | 6 | 14.4 | 93.0 |
| Aggravated Assault | 151 | 361.4 | 330.0 |
| Property Crime | 433 | 1,036.3 | 2,279.1 |
| Burglary | 50 | 119.7 | 287.8 |
| Larceny-Theft | 338 | 808.9 | 1,638.9 |
| Motor Vehicle Theft | 45 | 107.7 | 352.4 |
| Arson | 0 | 0.0 | 0.0 |
Marlboro vs Massachusetts Average
How does Marlboro's crime rate compare to the Massachusetts state average?
| Metric | Marlboro | Massachusetts Avg | Difference |
|---|---|---|---|
| Violent Crime Rate | 421.2 | 312.0 | +35.0% |
| Property Crime Rate | 1,036.3 | 1,086.7 | -4.6% |
| Murder Rate | 0.0 | 2.0 | -100.0% |
| Total Crime Rate | 1,457.5 | 1,398.7 | +4.2% |
Marlboro Crime Rate Trends
Year-over-year crime rate changes for Marlboro, Massachusetts.
| Year | Coverage | Total Crime Rate | Violent Crime Rate | Property Crime Rate |
|---|---|---|---|---|
| 2024 | 41,785 | 1,457.5 | 421.2 | 1,036.3 |
| 2023 | 40,773 | 1,557.4 | 365.4 | 1,192.0 |
| 2022 | 40,722 | 1,397.3 | 439.6 | 957.7 |
| 2021 | 39,682 | 1,396.1 | 360.4 | 1,035.7 |
| 2020 | 39,498 | 1,276.0 | 382.3 | 893.7 |
| 2019 | 39,673 | 1,711.5 | 375.6 | 1,335.9 |
Frequently Asked Questions
Is Marlboro, Massachusetts safe?
Marlboro has a safety score of 58/100, meaning it has less crime than about 58% of US cities in our FBI dataset. With a total crime rate of 1,457.5 per 100,000 residents in 2024, Marlboro is about average for a US city.
What is the crime rate in Marlboro, Massachusetts?
According to FBI data for 2024, Marlboro has a violent crime rate of 421.2 per 100,000 and a property crime rate of 1,036.3 per 100,000 residents.
How does Marlboro compare to the national average?
Marlboro's total crime rate of 1,457.5 per 100,000 can be compared to the national average. The data covers 41,785 residents.
What types of crime are most common in Marlboro?
Based on FBI 2024 data, the most reported crimes in Marlboro include larceny-theft, aggravated assault, and burglary. Property crime is generally more common than violent crime.
Is Marlboro safe to visit?
Like any city, Marlboro has areas that are safer than others. The city's overall safety score is 58/100 based on FBI crime data. Standard travel precautions are recommended.