 Violent
 Property
 Total
Total
Quick answer
According to crimebycity.com's analysis of FBI 2024 crime data, Quincy, MA has a Safety Score of 51/100 — safer than 51% of US cities — with a total crime rate of 1,667.8 per 100,000 residents, ranking #1,466 of 2,971 US cities and #158 of 186 in Massachusetts.
Safety Score
Violent Crime Rate
Property Crime Rate
Is Quincy, Massachusetts Safe?
Quincy, a South Shore city and birthplace of two U.S. Presidents, is home to over 100,000 residents. Its coastal location on Quincy Bay, part of Boston Harbor, shaped its shipbuilding and granite quarrying past.
Quincy has a safety score of 51/100 (Near National Average). Based on FBI data for 2024, the city reported a total crime rate of 1,667.8 per 100,000 residents, compared to the national average of 2,752.3 per 100,000.
Quincy ranks #158 out of 186 cities in Massachusetts and #1466 out of 2971 nationally (safest first). This places it in the 51st percentile for safety — safer than 51% of US cities.
Year over year, Quincy's total crime rate increased by 14.5%, with violent crime declining 2.2%.
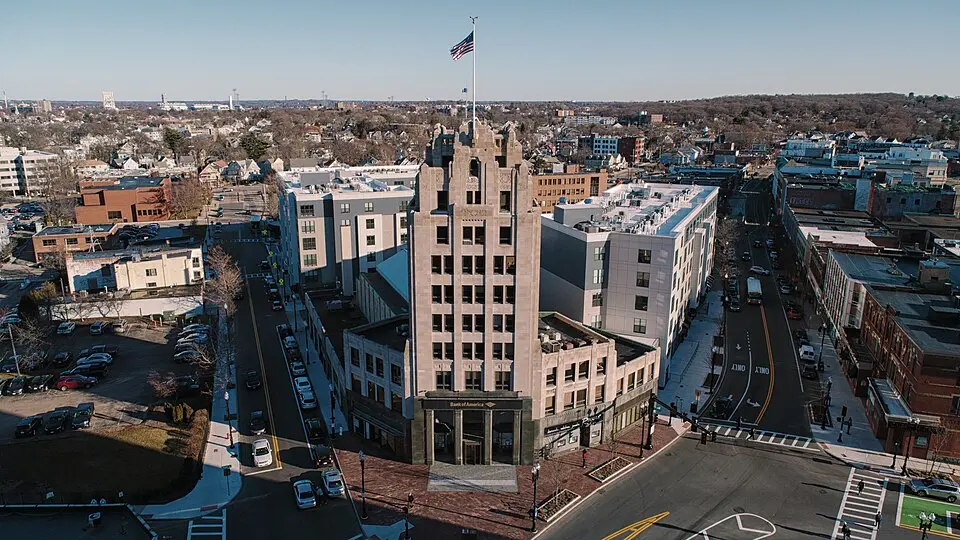
Photo: Wikimedia Commons
Quincy Crime Statistics Breakdown (2024)
| Crime Type | Incidents | Rate per 100K | National Avg |
|---|---|---|---|
| Violent Crime | 347 | 335.1 | 473.3 |
| Murder | 0 | 0.0 | 6.2 |
| Rape | 30 | 29.0 | 43.4 |
| Robbery | 25 | 24.1 | 93.0 |
| Aggravated Assault | 292 | 282.0 | 330.0 |
| Property Crime | 1,380 | 1,332.7 | 2,279.1 |
| Burglary | 154 | 148.7 | 287.8 |
| Larceny-Theft | 1,073 | 1,036.2 | 1,638.9 |
| Motor Vehicle Theft | 153 | 147.8 | 352.4 |
| Arson | 0 | 0.0 | 0.0 |
Quincy vs Massachusetts Average
How does Quincy's crime rate compare to the Massachusetts state average?
| Metric | Quincy | Massachusetts Avg | Difference |
|---|---|---|---|
| Violent Crime Rate | 335.1 | 312.0 | +7.4% |
| Property Crime Rate | 1,332.7 | 1,086.7 | +22.6% |
| Murder Rate | 0.0 | 2.0 | -100.0% |
| Total Crime Rate | 1,667.8 | 1,398.7 | +19.2% |
Quincy Crime Rate Trends
Year-over-year crime rate changes for Quincy, Massachusetts.
| Year | Coverage | Total Crime Rate | Violent Crime Rate | Property Crime Rate |
|---|---|---|---|---|
| 2024 | 103,550 | 1,667.8 | 335.1 | 1,332.7 |
| 2023 | 102,465 | 1,456.1 | 342.6 | 1,113.6 |
| 2022 | 101,434 | 1,487.7 | 397.3 | 1,090.4 |
| 2021 | 95,737 | 1,535.5 | 317.5 | 1,217.9 |
| 2020 | 94,519 | 1,534.1 | 321.6 | 1,212.5 |
| 2019 | 94,113 | 1,616.1 | 398.5 | 1,217.7 |
Frequently Asked Questions
Is Quincy, Massachusetts safe?
Quincy has a safety score of 51/100, meaning it has less crime than about 51% of US cities in our FBI dataset. With a total crime rate of 1,667.8 per 100,000 residents in 2024, Quincy is about average for a US city.
What is the crime rate in Quincy, Massachusetts?
According to FBI data for 2024, Quincy has a violent crime rate of 335.1 per 100,000 and a property crime rate of 1,332.7 per 100,000 residents.
How does Quincy compare to the national average?
Quincy's total crime rate of 1,667.8 per 100,000 can be compared to the national average. The data covers 103,550 residents.
What types of crime are most common in Quincy?
Based on FBI 2024 data, the most reported crimes in Quincy include larceny-theft, aggravated assault, and burglary. Property crime is generally more common than violent crime.
Is Quincy safe to visit?
Like any city, Quincy has areas that are safer than others. The city's overall safety score is 51/100 based on FBI crime data. Standard travel precautions are recommended.