 Violent
 Property
 Total
Total
Quick answer
According to crimebycity.com's analysis of FBI 2024 crime data, Richland, WA has a Safety Score of 35/100 — higher crime than 65% of US cities — with a total crime rate of 2,190.4 per 100,000 residents, ranking #1,922 of 2,971 US cities and #34 of 87 in Washington.
Safety Score
Violent Crime Rate
Property Crime Rate
Is Richland, Washington Safe?
Richland, a city in southeastern Washington at the confluence of the Yakima and Columbia rivers, was a key site for the Manhattan Project. Its population is around 60,000, with a notable number of engineers and scientists.
Richland has a safety score of 35/100 (Higher Crime Than Average). Based on FBI data for 2024, the city reported a total crime rate of 2,190.4 per 100,000 residents, compared to the national average of 2,752.3 per 100,000.
Richland ranks #34 out of 87 cities in Washington and #1922 out of 2971 nationally (safest first). This places it in the 35th percentile for safety — with higher crime than 65% of US cities.
The most elevated crime category in Richland is rape, at 61.8 per 100K — 1.4x the national average. Conversely, murder is relatively low at just 0.2x the national rate.
Year over year, Richland's total crime rate decreased by 22.3%, with violent crime declining 1.4%.
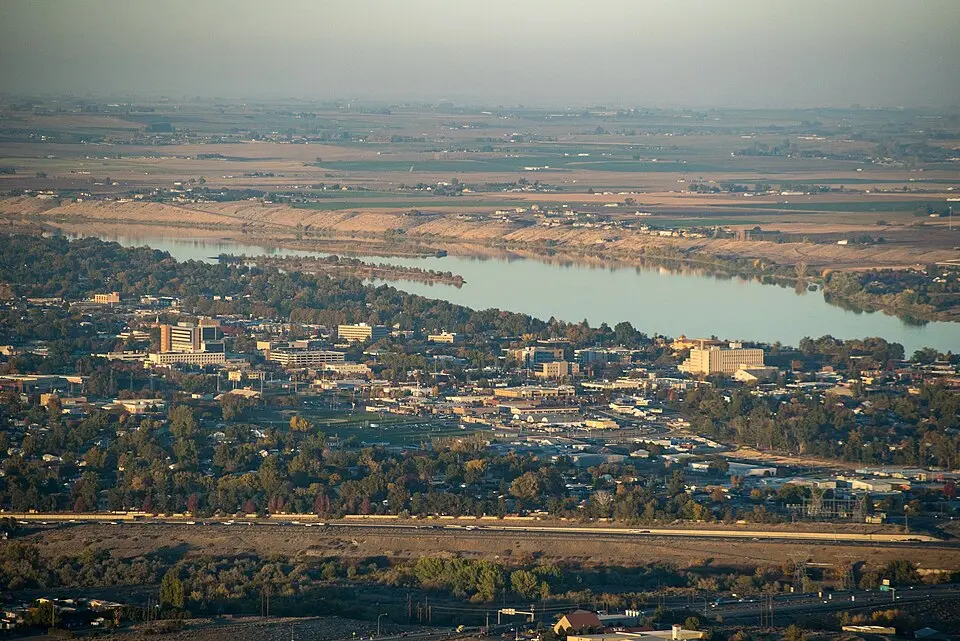
Photo: Wikimedia Commons
Richland Crime Statistics Breakdown (2024)
| Crime Type | Incidents | Rate per 100K | National Avg |
|---|---|---|---|
| Violent Crime | 162 | 250.3 | 473.3 |
| Murder | 1 | 1.5 | 6.2 |
| Rape | 40 | 61.8 | 43.4 |
| Robbery | 21 | 32.4 | 93.0 |
| Aggravated Assault | 100 | 154.5 | 330.0 |
| Property Crime | 1,256 | 1,940.2 | 2,279.1 |
| Burglary | 151 | 233.3 | 287.8 |
| Larceny-Theft | 927 | 1,432.0 | 1,638.9 |
| Motor Vehicle Theft | 178 | 275.0 | 352.4 |
| Arson | 0 | 0.0 | 0.0 |
Richland vs Washington Average
How does Richland's crime rate compare to the Washington state average?
| Metric | Richland | Washington Avg | Difference |
|---|---|---|---|
| Violent Crime Rate | 250.3 | 439.5 | -43.1% |
| Property Crime Rate | 1,940.2 | 3,428.6 | -43.4% |
| Murder Rate | 1.5 | 4.7 | -67.4% |
| Total Crime Rate | 2,190.4 | 3,868.1 | -43.4% |
Richland Crime Rate Trends
Year-over-year crime rate changes for Richland, Washington.
| Year | Coverage | Total Crime Rate | Violent Crime Rate | Property Crime Rate |
|---|---|---|---|---|
| 2024 | 64,736 | 2,190.4 | 250.3 | 1,940.2 |
| 2023 | 63,816 | 2,820.6 | 253.9 | 2,566.8 |
| 2022 | 63,081 | 4,051.9 | 325.0 | 3,727.0 |
| 2021 | 60,615 | 3,332.5 | 306.9 | 3,025.7 |
| 2020 | 59,370 | 2,940.9 | 294.8 | 2,646.1 |
| 2019 | 58,514 | 2,220.0 | 170.9 | 2,049.1 |
Frequently Asked Questions
Is Richland, Washington safe?
Richland has a safety score of 35/100, meaning it has less crime than about 35% of US cities in our FBI dataset. With a total crime rate of 2,190.4 per 100,000 residents in 2024, Richland is higher-crime than most US cities.
What is the crime rate in Richland, Washington?
According to FBI data for 2024, Richland has a violent crime rate of 250.3 per 100,000 and a property crime rate of 1,940.2 per 100,000 residents.
How does Richland compare to the national average?
Richland's total crime rate of 2,190.4 per 100,000 can be compared to the national average. The data covers 64,736 residents.
What types of crime are most common in Richland?
Based on FBI 2024 data, the most reported crimes in Richland include larceny-theft, aggravated assault, and burglary. Property crime is generally more common than violent crime.
Is Richland safe to visit?
Like any city, Richland has areas that are safer than others. The city's overall safety score is 35/100 based on FBI crime data. Standard travel precautions are recommended.