Is Fairfield or Richland Safer?
According to crimebycity.com's analysis of 2024 FBI data, Fairfield is safer than Richland (Safety Score 36/100 vs 35/100), with a total crime rate of 2,184 per 100,000 versus 2,190 for Richland — 0% lower. Fairfield has lower rates in 5 of 7 crime categories.
The biggest difference is in robbery, where Richland has a 72% lower rate.
Fairfield — 5-Year Trend
 Violent
 Property
Total
Property
Total
Richland — 5-Year Trend
Violent
Property
 Total
Total
Fairfield, CA
Richland, WA
Detailed Crime Rate Comparison
| Crime Type | Fairfield | Richland | Difference |
|---|---|---|---|
| Total Crime Rate | 2,184.5 | 2,190.4 | -6.0 |
| Violent Crime Rate | 498.8 | 250.3 | +248.6 |
| Murder Rate | 0.8 | 1.5 | -0.7 |
| Rape Rate | 40.5 | 61.8 | -21.3 |
| Robbery Rate | 117.3 | 32.4 | +84.8 |
| Aggravated Assault Rate | 339.4 | 154.5 | +185.0 |
| Property Crime Rate | 1,685.6 | 1,940.2 | -254.6 |
| Burglary Rate | 213.9 | 233.3 | -19.4 |
| Larceny-Theft Rate | 1,234.7 | 1,432.0 | -197.3 |
| Motor Vehicle Theft Rate | 237.0 | 275.0 | -37.9 |
All rates per 100,000 residents. Source: FBI UCR 2024.
Frequently Asked Questions
Is Fairfield or Richland safer?
Fairfield is safer with a total crime rate of 2,184 per 100K vs 2,190 for Richland — a 0% difference.
How do violent crime rates compare?
Fairfield has a violent crime rate of 498.8 per 100K while Richland has 250.3. Richland has lower violent crime.
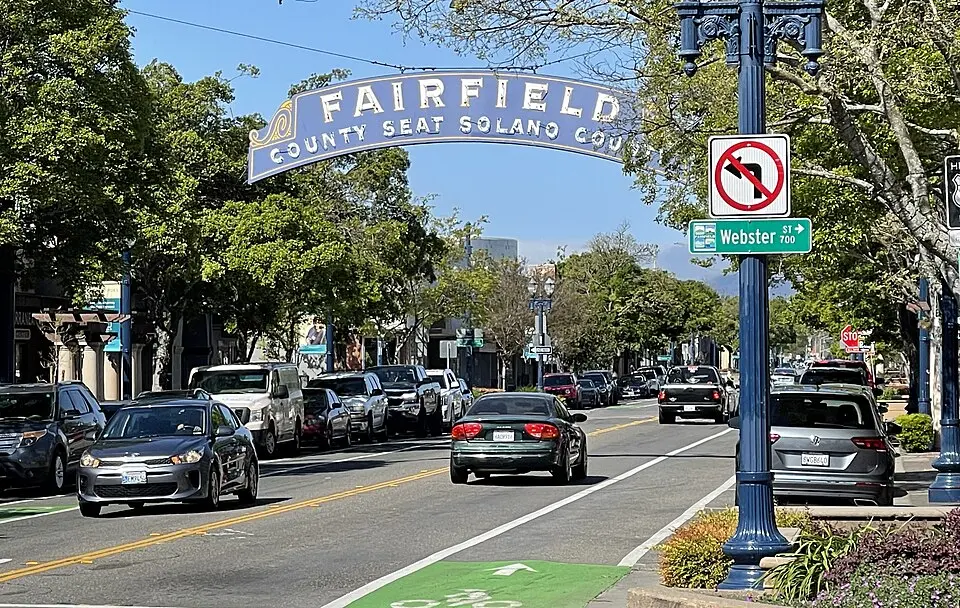
About Fairfield, CA
Fairfield, California, the county seat of Solano County, is home to Travis Air Force Base. Situated in the North Bay region, it's a diverse city with a significant Hispanic population. With a safety score of 36/100 and a population coverage of 121,082, Fairfield has a total crime rate of 2,184.5 per 100,000 residents.
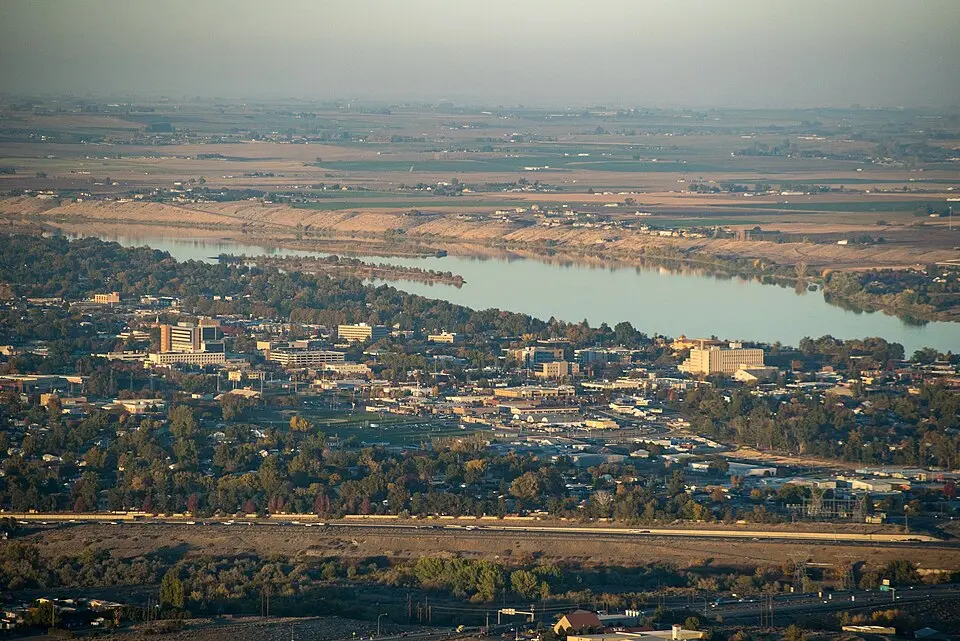
About Richland, WA
Richland, a city in southeastern Washington at the confluence of the Yakima and Columbia rivers, was a key site for the Manhattan Project. Its population is around 60,000, with a notable number of engineers and scientists. With a safety score of 35/100 and a population coverage of 64,736, Richland has a total crime rate of 2,190.4 per 100,000 residents.