Is Lowell or Richland Safer?
According to crimebycity.com's analysis of 2024 FBI data, Richland is safer than Lowell (Safety Score 35/100 vs 35/100), with a total crime rate of 2,190 per 100,000 versus 2,195 for Lowell — 0% lower. Lowell has lower rates in 4 of 7 crime categories.
The biggest difference is in murder, where Richland has a 64% lower rate.
Lowell — 5-Year Trend
 Violent
Property
Total
Violent
Property
Total
Richland — 5-Year Trend
Violent
 Property
 Total
Total
Lowell, MA
Richland, WA
Detailed Crime Rate Comparison
| Crime Type | Lowell | Richland | Difference |
|---|---|---|---|
| Total Crime Rate | 2,195.4 | 2,190.4 | +5.0 |
| Violent Crime Rate | 532.5 | 250.3 | +282.2 |
| Murder Rate | 4.3 | 1.5 | +2.8 |
| Rape Rate | 6.9 | 61.8 | -54.9 |
| Robbery Rate | 56.9 | 32.4 | +24.4 |
| Aggravated Assault Rate | 464.4 | 154.5 | +309.9 |
| Property Crime Rate | 1,662.9 | 1,940.2 | -277.3 |
| Burglary Rate | 149.9 | 233.3 | -83.3 |
| Larceny-Theft Rate | 1,309.6 | 1,432.0 | -122.3 |
| Motor Vehicle Theft Rate | 203.3 | 275.0 | -71.6 |
All rates per 100,000 residents. Source: FBI UCR 2024.
Frequently Asked Questions
Is Lowell or Richland safer?
Richland is safer with a total crime rate of 2,190 per 100K vs 2,195 for Lowell — a 0% difference.
How do violent crime rates compare?
Lowell has a violent crime rate of 532.5 per 100K while Richland has 250.3. Richland has lower violent crime.
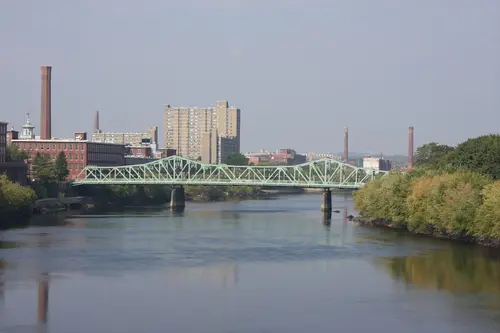
About Lowell, MA
Lowell, a historic mill city on the Merrimack River, was a birthplace of the American Industrial Revolution. Its diverse population includes a significant Cambodian American community. With a safety score of 35/100 and a population coverage of 116,062, Lowell has a total crime rate of 2,195.4 per 100,000 residents.
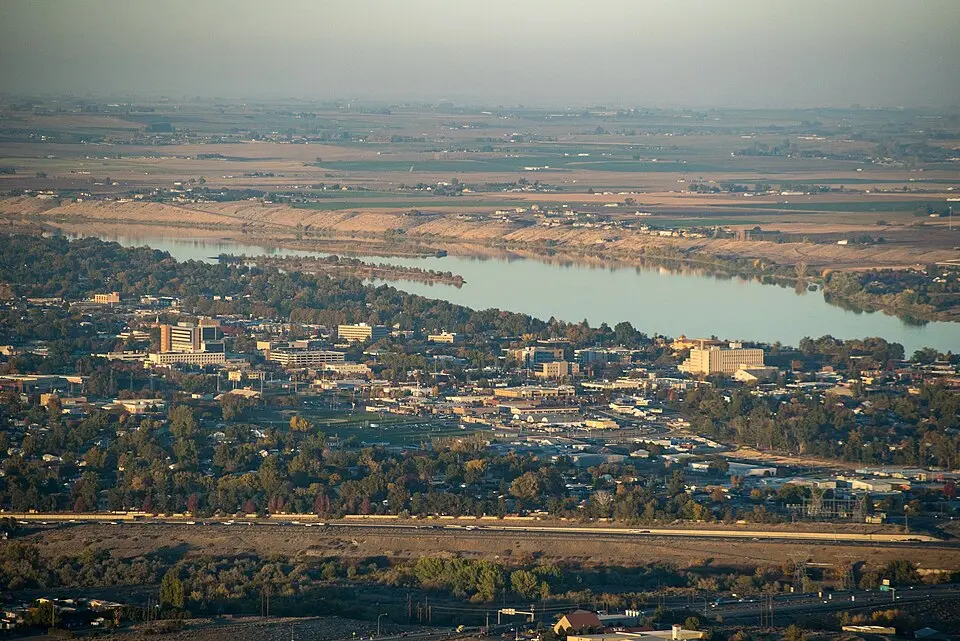
About Richland, WA
Richland, a city in southeastern Washington at the confluence of the Yakima and Columbia rivers, was a key site for the Manhattan Project. Its population is around 60,000, with a notable number of engineers and scientists. With a safety score of 35/100 and a population coverage of 64,736, Richland has a total crime rate of 2,190.4 per 100,000 residents.