Is Bridgewater or Lone Peak District - Police Safer?
According to crimebycity.com's analysis of 2024 FBI data, Lone Peak District - Police is safer than Bridgewater (Safety Score 99/100 vs 98/100), with a total crime rate of 198 per 100,000 versus 275 for Bridgewater — 28% lower. Bridgewater has higher rates in 1 of 5 crime categories.
The biggest difference is in violent crime, where Lone Peak District - Police has a 61% lower rate.
Bridgewater — 5-Year Trend
 Violent
Property
Total
Violent
Property
Total
Lone Peak District - Police — 5-Year Trend
 Violent
Property
Total
Violent
Property
Total
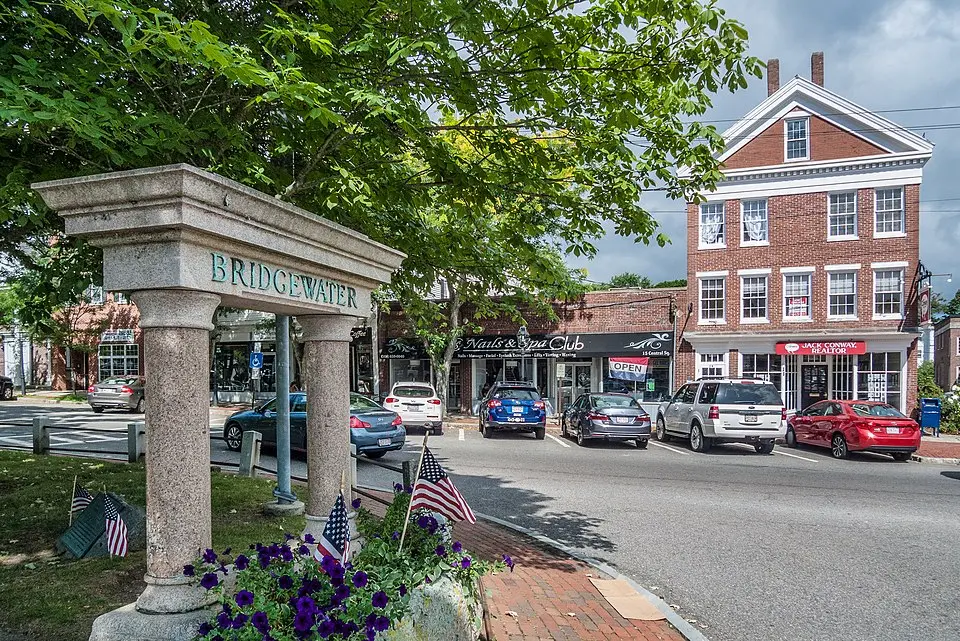
Bridgewater, MA
Lone Peak District - Police, UT
Detailed Crime Rate Comparison
| Crime Type | Bridgewater | Lone Peak District - Police | Difference |
|---|---|---|---|
| Total Crime Rate | 274.9 | 198.0 | +76.9 |
| Violent Crime Rate | 74.7 | 29.2 | +45.5 |
| Murder Rate | 0.0 | 0.0 | +0.0 |
| Rape Rate | 10.2 | 9.7 | +0.4 |
| Robbery Rate | 0.0 | 0.0 | +0.0 |
| Aggravated Assault Rate | 64.5 | 19.5 | +45.0 |
| Property Crime Rate | 200.2 | 168.8 | +31.5 |
| Burglary Rate | 13.6 | 35.7 | -22.1 |
| Larceny-Theft Rate | 112.0 | 103.9 | +8.1 |
| Motor Vehicle Theft Rate | 74.7 | 29.2 | +45.5 |
All rates per 100,000 residents. Source: FBI UCR 2024.
Frequently Asked Questions
Is Bridgewater or Lone Peak District - Police safer?
Lone Peak District - Police is safer with a total crime rate of 198 per 100K vs 275 for Bridgewater — a 28% difference.
How do violent crime rates compare?
Bridgewater has a violent crime rate of 74.7 per 100K while Lone Peak District - Police has 29.2. Lone Peak District - Police has lower violent crime.
About Bridgewater, MA
Bridgewater, home to a state university established in 1840, is a town in Plymouth County. It features a diverse population and a mix of suburban and rural landscapes. With a safety score of 98/100 and a population coverage of 29,465, Bridgewater has a total crime rate of 274.9 per 100,000 residents.
About Lone Peak District - Police, UT
Lone Peak District, encompassing Highland and Alpine, Utah, is a rapidly growing suburban area at the base of the Wasatch Range. This region, once primarily agricultural, has seen significant development, attracting a young, affluent, and highly educated population. With a safety score of 99/100 and a population coverage of 30,812, Lone Peak District - Police has a total crime rate of 198.0 per 100,000 residents.
More Crime Rate Comparisons
Compare Bridgewater
Compare Lone Peak District - Police
- Is Lone Peak District - Police safer than Philadelphia, PA?
- Is Lone Peak District - Police safer than San Antonio, TX?
- Is Lone Peak District - Police safer than San Diego, CA?
- Is Lone Peak District - Police safer than Dallas, TX?
- Is Lone Peak District - Police safer than Charlotte - Mecklenburg, NC?
- Is Lone Peak District - Police safer than Fort Worth, TX?