Is Burlingame or Newington Safer?
According to crimebycity.com's analysis of 2024 FBI data, Burlingame is safer than Newington (Safety Score 35/100 vs 35/100), with a total crime rate of 2,209 per 100,000 versus 2,212 for Newington — 0% lower. Burlingame has lower rates in 4 of 6 crime categories.
The biggest difference is in violent crime, where Newington has a 58% lower rate.
Burlingame — 5-Year Trend
 Violent
Property
Total
Violent
Property
Total
Newington — 5-Year Trend
 Violent
Property
Total
Violent
Property
Total
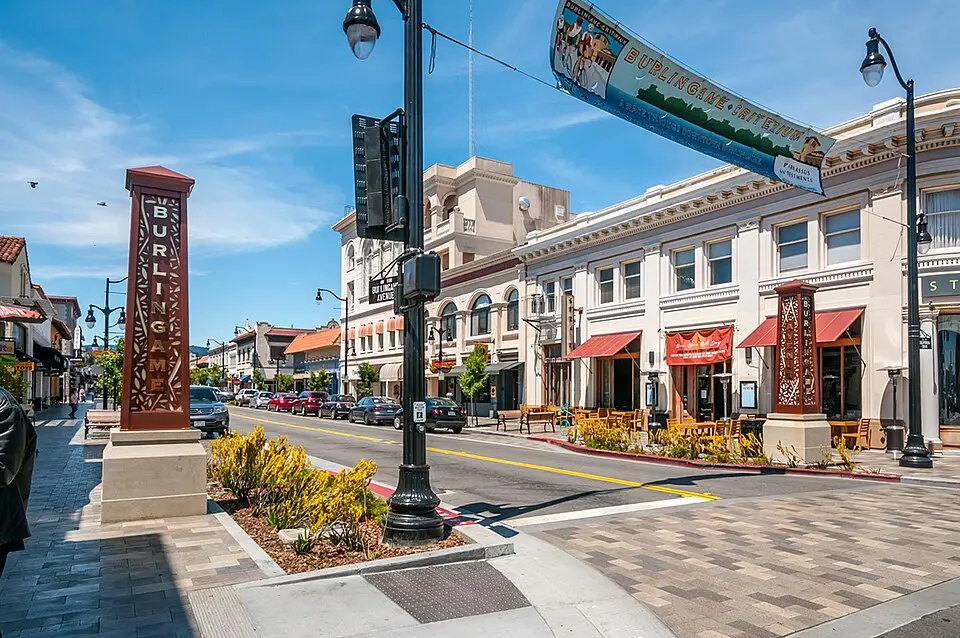
Burlingame, CA
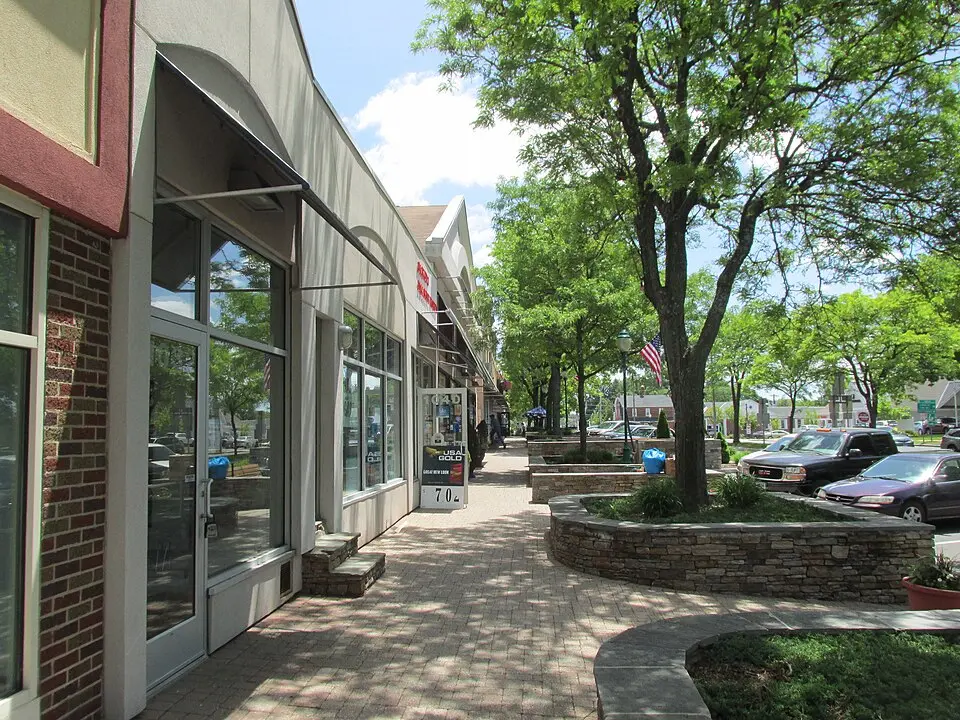
Newington, CT
Detailed Crime Rate Comparison
| Crime Type | Burlingame | Newington | Difference |
|---|---|---|---|
| Total Crime Rate | 2,209.0 | 2,212.4 | -3.5 |
| Violent Crime Rate | 183.2 | 76.2 | +107.1 |
| Murder Rate | 0.0 | 0.0 | +0.0 |
| Rape Rate | 33.9 | 25.4 | +8.5 |
| Robbery Rate | 20.4 | 22.2 | -1.9 |
| Aggravated Assault Rate | 128.9 | 28.6 | +100.4 |
| Property Crime Rate | 2,025.7 | 2,136.2 | -110.5 |
| Burglary Rate | 98.4 | 177.8 | -79.4 |
| Larceny-Theft Rate | 1,740.7 | 1,815.6 | -75.0 |
| Motor Vehicle Theft Rate | 186.6 | 142.8 | +43.8 |
All rates per 100,000 residents. Source: FBI UCR 2024.
Frequently Asked Questions
Is Burlingame or Newington safer?
Burlingame is safer with a total crime rate of 2,209 per 100K vs 2,212 for Newington — a 0% difference.
How do violent crime rates compare?
Burlingame has a violent crime rate of 183.2 per 100K while Newington has 76.2. Newington has lower violent crime.
About Burlingame, CA
Burlingame, "City of Trees," is an affluent San Francisco Peninsula city. It's home to many tech workers and boasts a vibrant downtown near San Francisco International Airport. With a safety score of 35/100 and a population coverage of 29,471, Burlingame has a total crime rate of 2,209.0 per 100,000 residents.
About Newington, CT
Newington, Connecticut, a Hartford suburb, is home to the first-ever organized town-wide park and recreation department. Situated just south of West Hartford, the town has a population of over 30,000 residents. With a safety score of 35/100 and a population coverage of 31,504, Newington has a total crime rate of 2,212.4 per 100,000 residents.