Is Burlingame or Upper Moreland Township Safer?
According to crimebycity.com's analysis of 2024 FBI data, Burlingame is safer than Upper Moreland Township (Safety Score 35/100 vs 35/100), with a total crime rate of 2,209 per 100,000 versus 2,221 for Upper Moreland Township — 1% lower. Burlingame has higher rates in 3 of 7 crime categories.
The biggest difference is in murder, where Burlingame has a 100% lower rate.
Burlingame — 5-Year Trend
 Violent
Property
Total
Violent
Property
Total
Upper Moreland Township — 5-Year Trend
 Violent
Property
Total
Violent
Property
Total
Burlingame, CA
Upper Moreland Township, PA
Detailed Crime Rate Comparison
| Crime Type | Burlingame | Upper Moreland Township | Difference |
|---|---|---|---|
| Total Crime Rate | 2,209.0 | 2,221.4 | -12.4 |
| Violent Crime Rate | 183.2 | 107.6 | +75.6 |
| Murder Rate | 0.0 | 3.8 | -3.8 |
| Rape Rate | 33.9 | 15.4 | +18.6 |
| Robbery Rate | 20.4 | 19.2 | +1.1 |
| Aggravated Assault Rate | 128.9 | 69.2 | +59.8 |
| Property Crime Rate | 2,025.7 | 2,113.8 | -88.0 |
| Burglary Rate | 98.4 | 69.2 | +29.2 |
| Larceny-Theft Rate | 1,740.7 | 1,963.9 | -223.2 |
| Motor Vehicle Theft Rate | 186.6 | 80.7 | +105.9 |
All rates per 100,000 residents. Source: FBI UCR 2024.
Frequently Asked Questions
Is Burlingame or Upper Moreland Township safer?
Burlingame is safer with a total crime rate of 2,209 per 100K vs 2,221 for Upper Moreland Township — a 1% difference.
How do violent crime rates compare?
Burlingame has a violent crime rate of 183.2 per 100K while Upper Moreland Township has 107.6. Upper Moreland Township has lower violent crime.
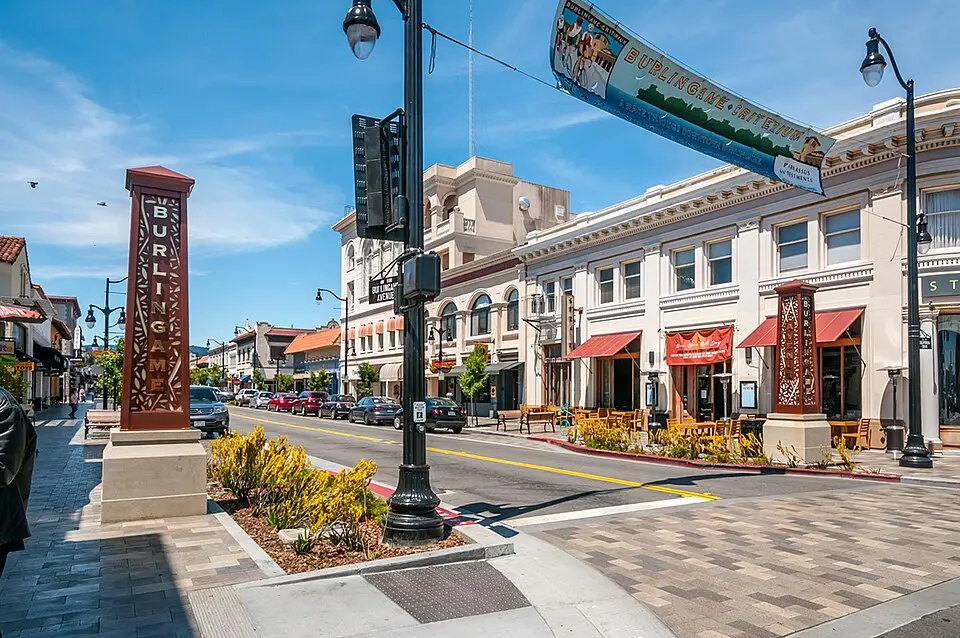
About Burlingame, CA
Burlingame, "City of Trees," is an affluent San Francisco Peninsula city. It's home to many tech workers and boasts a vibrant downtown near San Francisco International Airport. With a safety score of 35/100 and a population coverage of 29,471, Burlingame has a total crime rate of 2,209.0 per 100,000 residents.
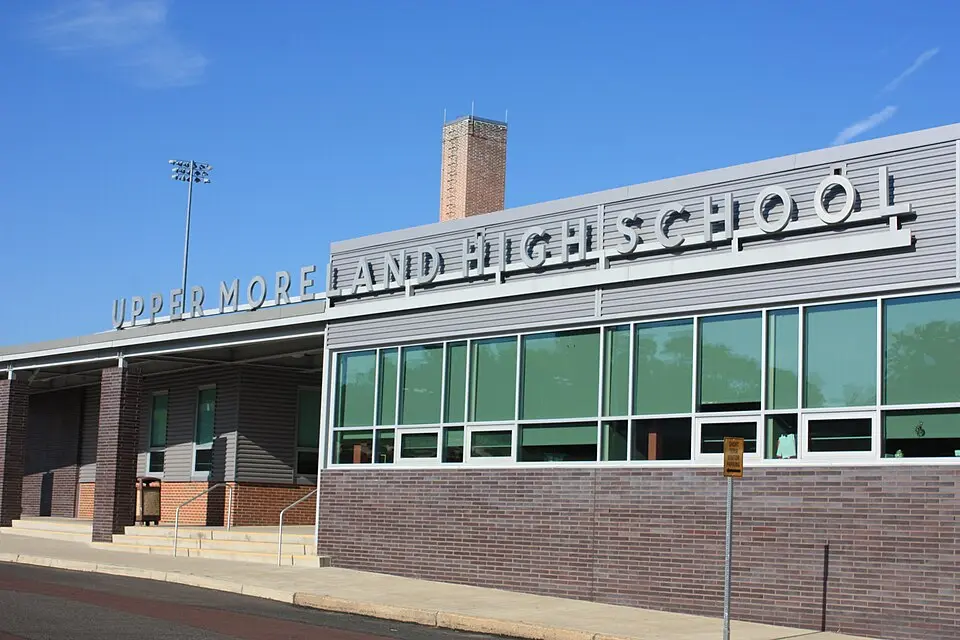
About Upper Moreland Township, PA
Upper Moreland Township, PA, a Montgomery County suburb, was historically home to the Willow Grove Amusement Park. This densely populated area features a mix of residential neighborhoods and commercial centers. With a safety score of 35/100 and a population coverage of 26,020, Upper Moreland Township has a total crime rate of 2,221.4 per 100,000 residents.
More Crime Rate Comparisons
Compare Burlingame
Compare Upper Moreland Township
- Is Upper Moreland Township safer than Philadelphia, PA?
- Is Upper Moreland Township safer than San Antonio, TX?
- Is Upper Moreland Township safer than San Diego, CA?
- Is Upper Moreland Township safer than Dallas, TX?
- Is Upper Moreland Township safer than Charlotte - Mecklenburg, NC?
- Is Upper Moreland Township safer than Fort Worth, TX?