Is Carrollton or Fontana Safer?
According to crimebycity.com's analysis of 2024 FBI data, Carrollton is safer than Fontana (Safety Score 58/100 vs 57/100), with a total crime rate of 1,453 per 100,000 versus 1,487 for Fontana — 2% lower. Carrollton has lower rates in 4 of 7 crime categories.
The biggest difference is in robbery, where Carrollton has a 60% lower rate.
Carrollton — 4-Year Trend
 Violent
 Property
Total
Property
Total
Fontana — 5-Year Trend
 Violent
Property
Total
Violent
Property
Total
Carrollton, TX
Fontana, CA
Detailed Crime Rate Comparison
| Crime Type | Carrollton | Fontana | Difference |
|---|---|---|---|
| Total Crime Rate | 1,452.8 | 1,486.6 | -33.9 |
| Violent Crime Rate | 137.1 | 270.2 | -133.1 |
| Murder Rate | 0.8 | 0.9 | -0.2 |
| Rape Rate | 12.7 | 22.1 | -9.3 |
| Robbery Rate | 22.5 | 56.1 | -33.6 |
| Aggravated Assault Rate | 101.2 | 191.2 | -90.0 |
| Property Crime Rate | 1,315.6 | 1,216.4 | +99.2 |
| Burglary Rate | 152.1 | 146.6 | +5.5 |
| Larceny-Theft Rate | 961.3 | 794.1 | +167.2 |
| Motor Vehicle Theft Rate | 202.3 | 275.7 | -73.4 |
All rates per 100,000 residents. Source: FBI UCR 2024.
Frequently Asked Questions
Is Carrollton or Fontana safer?
Carrollton is safer with a total crime rate of 1,453 per 100K vs 1,487 for Fontana — a 2% difference.
How do violent crime rates compare?
Carrollton has a violent crime rate of 137.1 per 100K while Fontana has 270.2. Carrollton has lower violent crime.
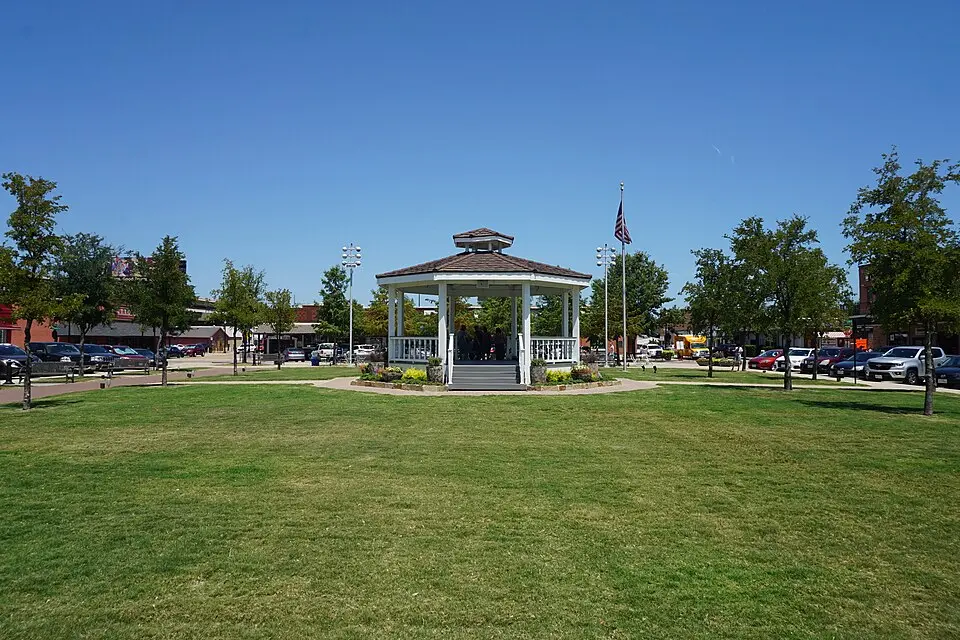
About Carrollton, TX
Carrollton, a Dallas suburb, was once a farming community and now boasts a diverse population exceeding 130,000. It's known for its many parks and proximity to major highways. With a safety score of 58/100 and a population coverage of 133,471, Carrollton has a total crime rate of 1,452.8 per 100,000 residents.
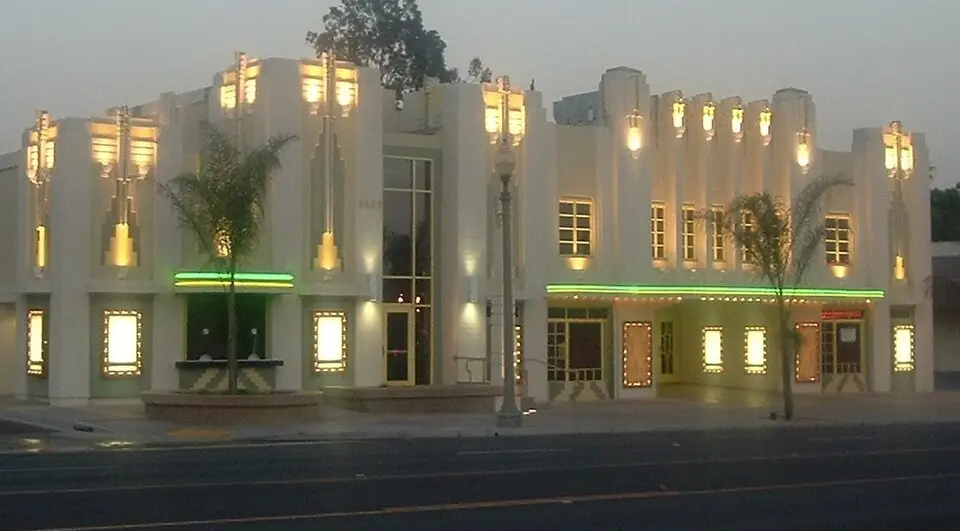
About Fontana, CA
Fontana, at the foot of the San Gabriel Mountains in San Bernardino County, was once a major agricultural hub, especially for citrus. It's now a diverse, growing city with a significant Latino population. With a safety score of 57/100 and a population coverage of 217,605, Fontana has a total crime rate of 1,486.6 per 100,000 residents.