Is Clayton or Petaluma Safer?
According to crimebycity.com's analysis of 2024 FBI data, Petaluma is safer than Clayton (Safety Score 58/100 vs 58/100), with a total crime rate of 1,445 per 100,000 versus 1,451 for Clayton — 0% lower. Clayton has higher rates in 3 of 6 crime categories.
The biggest difference is in robbery, where Clayton has a 57% lower rate.
Clayton — 5-Year Trend
 Violent
 Property
Total
Property
Total
Petaluma — 5-Year Trend
Violent
Property
Total
Clayton, NC
Petaluma, CA
Detailed Crime Rate Comparison
| Crime Type | Clayton | Petaluma | Difference |
|---|---|---|---|
| Total Crime Rate | 1,451.1 | 1,444.6 | +6.5 |
| Violent Crime Rate | 168.3 | 271.8 | -103.5 |
| Murder Rate | 0.0 | 0.0 | +0.0 |
| Rape Rate | 19.1 | 44.5 | -25.4 |
| Robbery Rate | 19.1 | 44.5 | -25.4 |
| Aggravated Assault Rate | 130.2 | 182.9 | -52.8 |
| Property Crime Rate | 1,282.8 | 1,172.8 | +110.0 |
| Burglary Rate | 54.0 | 95.7 | -41.8 |
| Larceny-Theft Rate | 1,063.7 | 976.2 | +87.5 |
| Motor Vehicle Theft Rate | 165.1 | 100.9 | +64.2 |
All rates per 100,000 residents. Source: FBI UCR 2024.
Frequently Asked Questions
Is Clayton or Petaluma safer?
Petaluma is safer with a total crime rate of 1,445 per 100K vs 1,451 for Clayton — a 0% difference.
How do violent crime rates compare?
Clayton has a violent crime rate of 168.3 per 100K while Petaluma has 271.8. Clayton has lower violent crime.
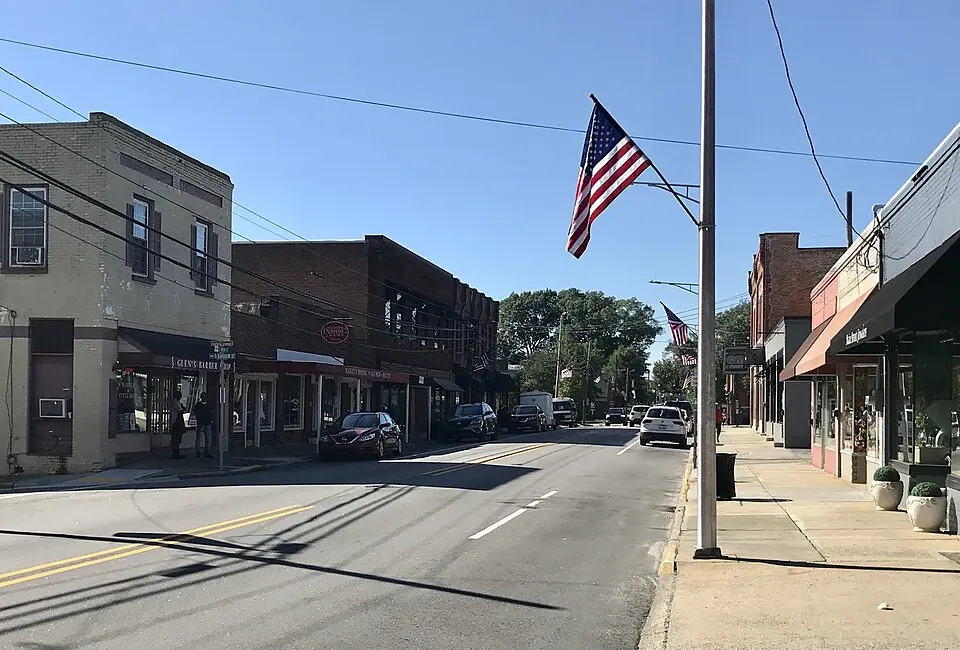
About Clayton, NC
Clayton, NC, a town in Johnston County, has grown significantly from its agricultural roots, still evident in its annual Harvest Festival. It's now a rapidly developing suburb, home to many commuting to Research Triangle Park. With a safety score of 58/100 and a population coverage of 31,494, Clayton has a total crime rate of 1,451.1 per 100,000 residents.
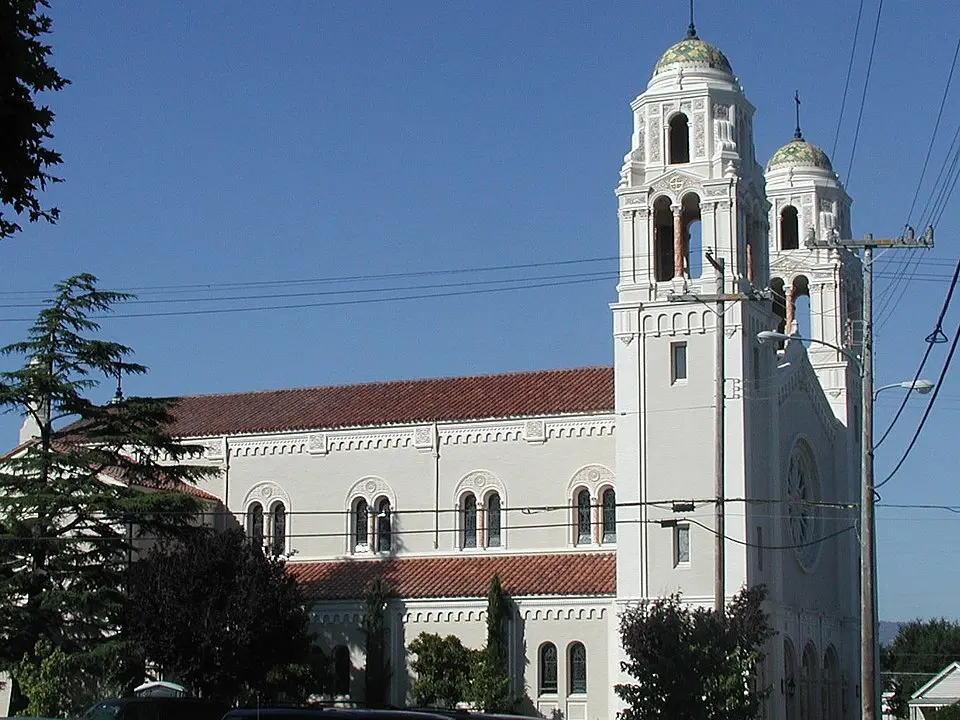
About Petaluma, CA
Nestled in Sonoma County, Petaluma is a historic dairy town known for its well-preserved iron-front buildings and a population of around 60,000. It straddles the Petaluma River, flowing into San Pablo Bay. With a safety score of 58/100 and a population coverage of 58,493, Petaluma has a total crime rate of 1,444.6 per 100,000 residents.