Is Denison or Washington City Safer?
According to crimebycity.com's analysis of 2024 FBI data, Washington City is safer than Denison (Safety Score 74/100 vs 74/100), with a total crime rate of 999 per 100,000 versus 1,008 for Denison — 1% lower. Denison has higher rates in 2 of 7 crime categories.
The biggest difference is in robbery, where Washington City has a 62% lower rate.
Denison — 5-Year Trend
 Violent
Property
Total
Violent
Property
Total
Washington City — 5-Year Trend
 Violent
Property
Total
Violent
Property
Total
Denison, TX
Washington City, UT
Detailed Crime Rate Comparison
| Crime Type | Denison | Washington City | Difference |
|---|---|---|---|
| Total Crime Rate | 1,008.3 | 999.0 | +9.3 |
| Violent Crime Rate | 192.8 | 150.7 | +42.1 |
| Murder Rate | 11.1 | 8.4 | +2.8 |
| Rape Rate | 37.1 | 47.4 | -10.4 |
| Robbery Rate | 14.8 | 5.6 | +9.3 |
| Aggravated Assault Rate | 111.2 | 89.3 | +21.9 |
| Property Crime Rate | 815.5 | 848.3 | -32.8 |
| Burglary Rate | 177.9 | 94.9 | +83.1 |
| Larceny-Theft Rate | 444.8 | 711.6 | -266.8 |
| Motor Vehicle Theft Rate | 192.8 | 41.9 | +150.9 |
All rates per 100,000 residents. Source: FBI UCR 2024.
Frequently Asked Questions
Is Denison or Washington City safer?
Washington City is safer with a total crime rate of 999 per 100K vs 1,008 for Denison — a 1% difference.
How do violent crime rates compare?
Denison has a violent crime rate of 192.8 per 100K while Washington City has 150.7. Washington City has lower violent crime.
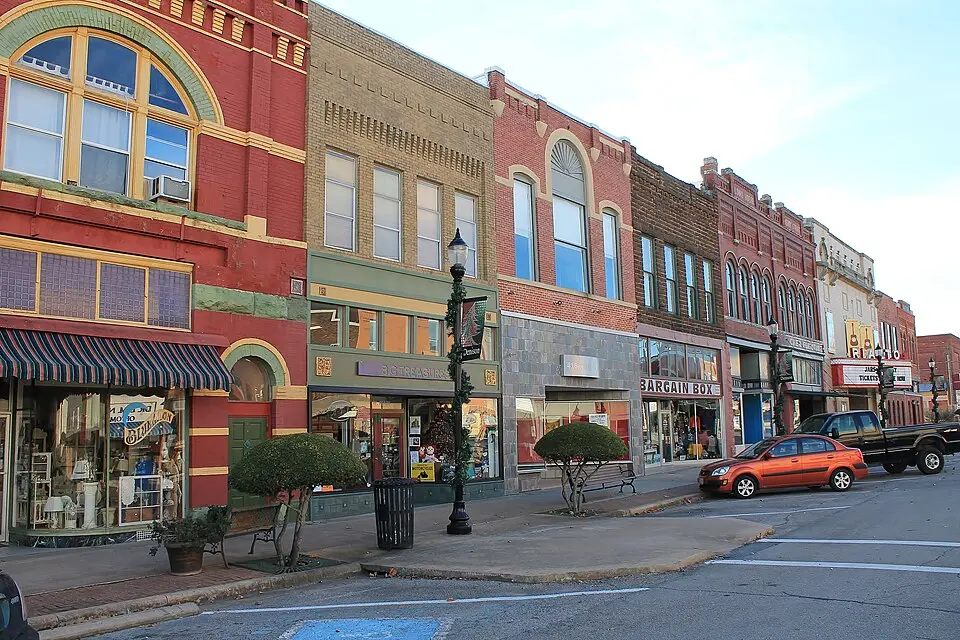
About Denison, TX
Denison, Texas, a historic railroad town, sits in Grayson County near Lake Texoma. This North Texas community, birthplace of President Dwight D. Eisenhower, has a population of over 17,000. With a safety score of 74/100 and a population coverage of 26,977, Denison has a total crime rate of 1,008.3 per 100,000 residents.
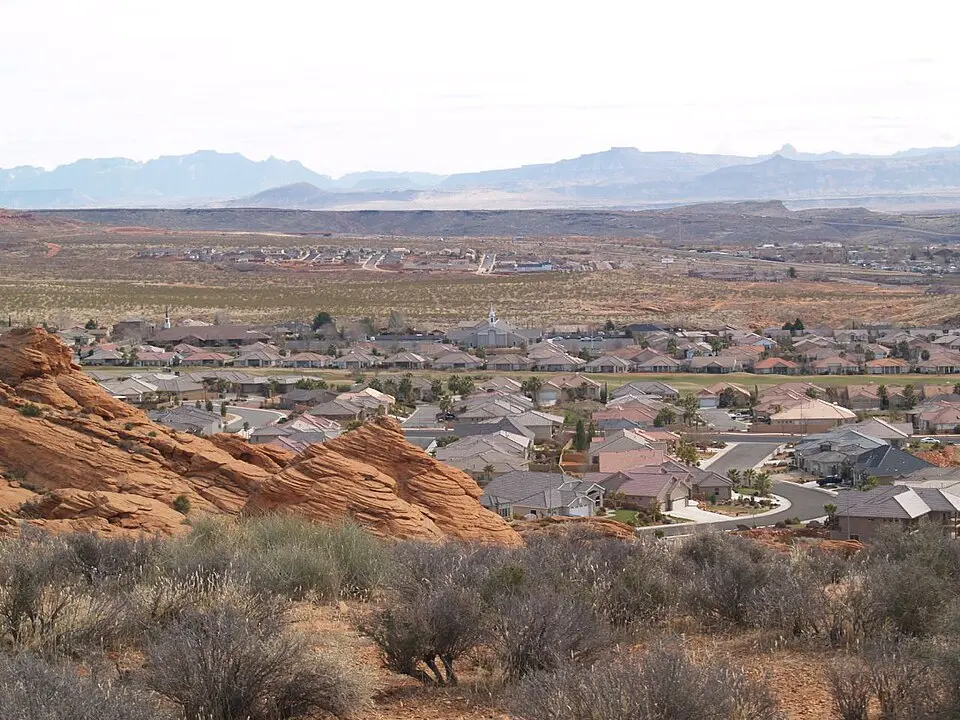
About Washington City, UT
Washington City, Utah, a sun-drenched town in Washington County, is known for its pioneer heritage and proximity to Zion National Park. Its population has seen significant growth, attracting new residents to the St. George metropolitan area. With a safety score of 74/100 and a population coverage of 35,835, Washington City has a total crime rate of 999.0 per 100,000 residents.