Is Fort Worth or San Jose Safer?
According to crimebycity.com's analysis of 2024 FBI data, Fort Worth is safer than San Jose (Safety Score 17/100 vs 16/100), with a total crime rate of 3,158 per 100,000 versus 3,195 for San Jose — 1% lower. Fort Worth has lower rates in 4 of 7 crime categories.
The biggest difference is in murder, where San Jose has a 63% lower rate.
Fort Worth — 5-Year Trend
 Violent
Property
Total
Violent
Property
Total
San Jose — 5-Year Trend
 Violent
Property
Total
Violent
Property
Total
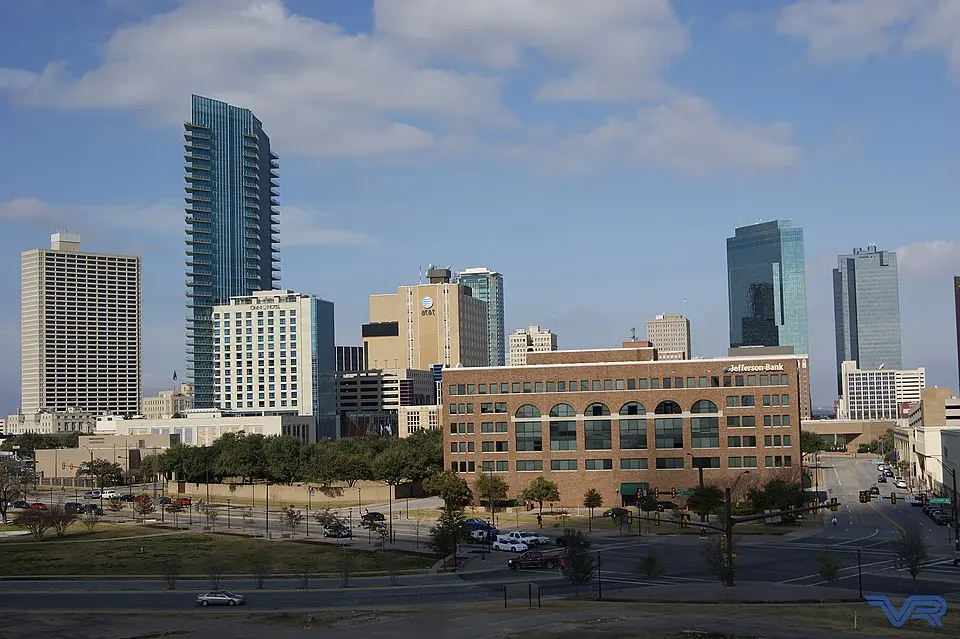
Fort Worth, TX
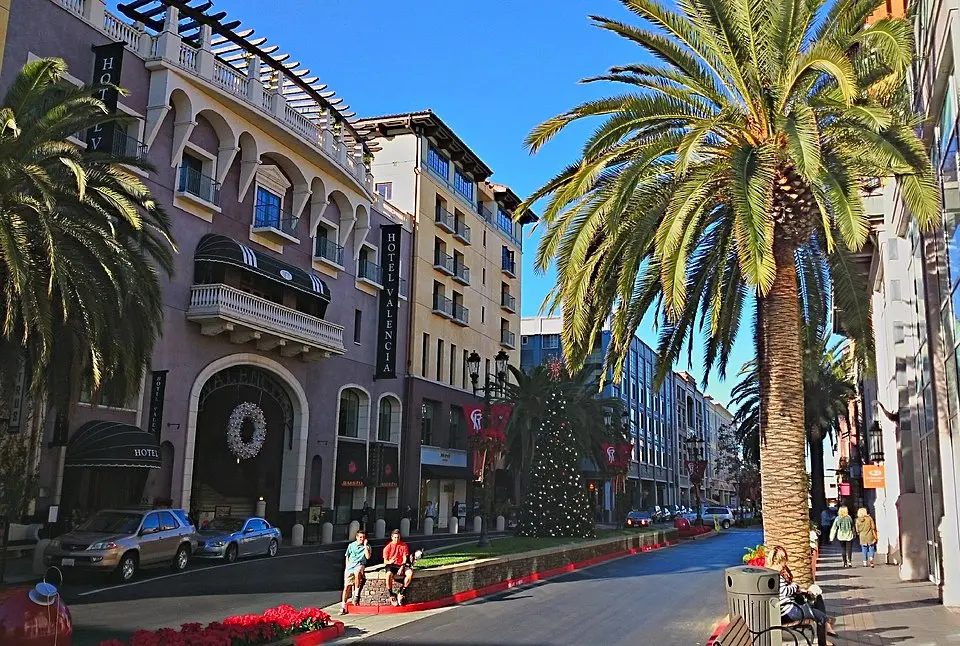
San Jose, CA
Detailed Crime Rate Comparison
| Crime Type | Fort Worth | San Jose | Difference |
|---|---|---|---|
| Total Crime Rate | 3,158.5 | 3,194.8 | -36.3 |
| Violent Crime Rate | 458.7 | 606.9 | -148.2 |
| Murder Rate | 7.4 | 2.7 | +4.7 |
| Rape Rate | 55.2 | 77.3 | -22.1 |
| Robbery Rate | 72.6 | 140.8 | -68.2 |
| Aggravated Assault Rate | 323.1 | 386.0 | -62.8 |
| Property Crime Rate | 2,699.8 | 2,587.9 | +111.9 |
| Burglary Rate | 344.6 | 427.0 | -82.5 |
| Larceny-Theft Rate | 1,841.9 | 1,523.2 | +318.6 |
| Motor Vehicle Theft Rate | 513.4 | 637.6 | -124.2 |
All rates per 100,000 residents. Source: FBI UCR 2024.
Frequently Asked Questions
Is Fort Worth or San Jose safer?
Fort Worth is safer with a total crime rate of 3,158 per 100K vs 3,195 for San Jose — a 1% difference.
How do violent crime rates compare?
Fort Worth has a violent crime rate of 458.7 per 100K while San Jose has 606.9. Fort Worth has lower violent crime.
About Fort Worth, TX
Fort Worth, a city where the West begins, boasts a rich cattle drive history evident in the Stockyards National Historic District. Located in North Central Texas, it's a populous city within the Dallas-Fort Worth-Arlington metropolitan area. With a safety score of 17/100 and a population coverage of 997,476, Fort Worth has a total crime rate of 3,158.5 per 100,000 residents.
About San Jose, CA
San Jose, the largest city in Northern California, is a diverse Silicon Valley hub with a rich history, once serving as California's first state capital. Located at the southern end of the San Francisco Bay, its population reflects a broad range of ethnicities and income levels. With a safety score of 16/100 and a population coverage of 956,840, San Jose has a total crime rate of 3,194.8 per 100,000 residents.