Is Gilroy or San Marcos Safer?
According to crimebycity.com's analysis of 2024 FBI data, San Marcos is safer than Gilroy (Safety Score 26/100 vs 26/100), with a total crime rate of 2,617 per 100,000 versus 2,625 for Gilroy — 0% lower. Gilroy has higher rates in 3 of 6 crime categories.
The biggest difference is in robbery, where San Marcos has a 67% lower rate.
Gilroy — 5-Year Trend
 Violent
 Property
Total
Property
Total
San Marcos — 5-Year Trend
 Violent
Property
Total
Violent
Property
Total
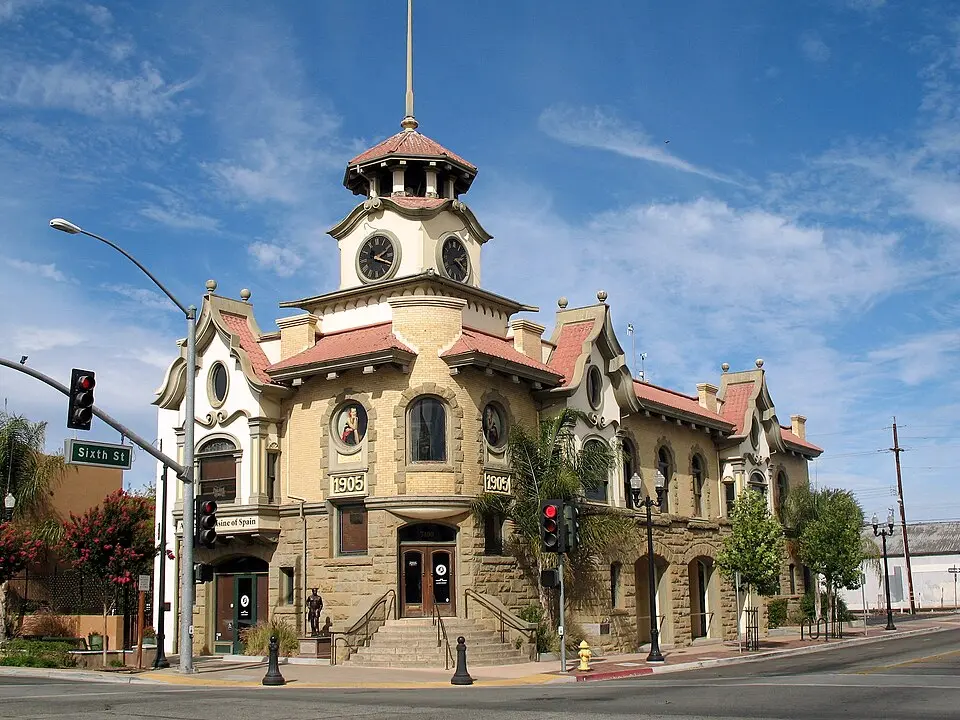
Gilroy, CA
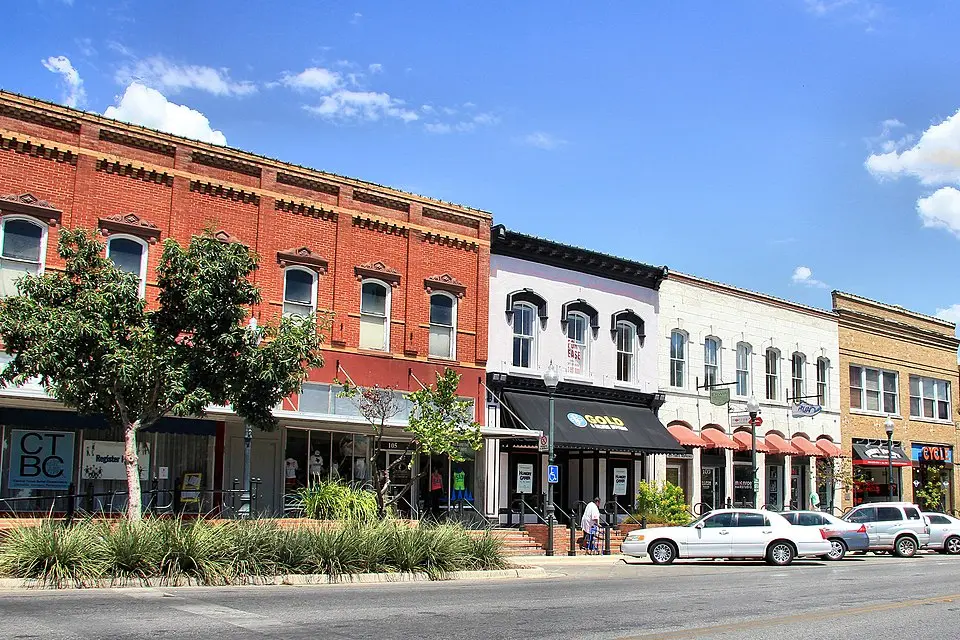
San Marcos, TX
Detailed Crime Rate Comparison
| Crime Type | Gilroy | San Marcos | Difference |
|---|---|---|---|
| Total Crime Rate | 2,624.5 | 2,616.8 | +7.8 |
| Violent Crime Rate | 461.3 | 358.9 | +102.4 |
| Murder Rate | 0.0 | 0.0 | +0.0 |
| Rape Rate | 55.3 | 96.3 | -41.0 |
| Robbery Rate | 114.0 | 37.1 | +76.9 |
| Aggravated Assault Rate | 292.0 | 225.5 | +66.5 |
| Property Crime Rate | 2,163.2 | 2,257.9 | -94.7 |
| Burglary Rate | 255.7 | 266.8 | -11.1 |
| Larceny-Theft Rate | 1,504.9 | 1,600.6 | -95.7 |
| Motor Vehicle Theft Rate | 402.6 | 390.5 | +12.1 |
All rates per 100,000 residents. Source: FBI UCR 2024.
Frequently Asked Questions
Is Gilroy or San Marcos safer?
San Marcos is safer with a total crime rate of 2,617 per 100K vs 2,625 for Gilroy — a 0% difference.
How do violent crime rates compare?
Gilroy has a violent crime rate of 461.3 per 100K while San Marcos has 358.9. San Marcos has lower violent crime.
About Gilroy, CA
Gilroy, the "Garlic Capital of the World," is a city in Santa Clara County, known for its annual Garlic Festival. Located in a primarily agricultural region, its population is diverse, including a significant Hispanic community. With a safety score of 26/100 and a population coverage of 57,877, Gilroy has a total crime rate of 2,624.5 per 100,000 residents.
About San Marcos, TX
San Marcos, a city in Hays County, is known for the Meadows Center for Water and the Environment at Spring Lake, home to several endangered species. Its population is primarily students attending Texas State University. With a safety score of 26/100 and a population coverage of 72,723, San Marcos has a total crime rate of 2,616.8 per 100,000 residents.