Is Kirkland or Round Rock Safer?
According to crimebycity.com's analysis of 2024 FBI data, Round Rock is safer than Kirkland (Safety Score 38/100 vs 38/100), with a total crime rate of 2,071 per 100,000 versus 2,073 for Kirkland — 0% lower. Kirkland has lower rates in 4 of 7 crime categories.
The biggest difference is in violent crime, where Kirkland has a 54% lower rate.
Kirkland — 5-Year Trend
 Violent
 Property
Total
Property
Total
Round Rock — 5-Year Trend
 Violent
Property
Total
Violent
Property
Total
Kirkland, WA
Round Rock, TX
Detailed Crime Rate Comparison
| Crime Type | Kirkland | Round Rock | Difference |
|---|---|---|---|
| Total Crime Rate | 2,073.1 | 2,071.4 | +1.6 |
| Violent Crime Rate | 60.7 | 130.7 | -70.1 |
| Murder Rate | 1.1 | 1.5 | -0.4 |
| Rape Rate | 14.3 | 29.1 | -14.8 |
| Robbery Rate | 9.9 | 17.2 | -7.3 |
| Aggravated Assault Rate | 35.3 | 82.9 | -47.6 |
| Property Crime Rate | 2,012.4 | 1,940.7 | +71.7 |
| Burglary Rate | 222.7 | 170.3 | +52.4 |
| Larceny-Theft Rate | 1,543.8 | 1,629.2 | -85.5 |
| Motor Vehicle Theft Rate | 245.9 | 141.2 | +104.7 |
All rates per 100,000 residents. Source: FBI UCR 2024.
Frequently Asked Questions
Is Kirkland or Round Rock safer?
Round Rock is safer with a total crime rate of 2,071 per 100K vs 2,073 for Kirkland — a 0% difference.
How do violent crime rates compare?
Kirkland has a violent crime rate of 60.7 per 100K while Round Rock has 130.7. Kirkland has lower violent crime.
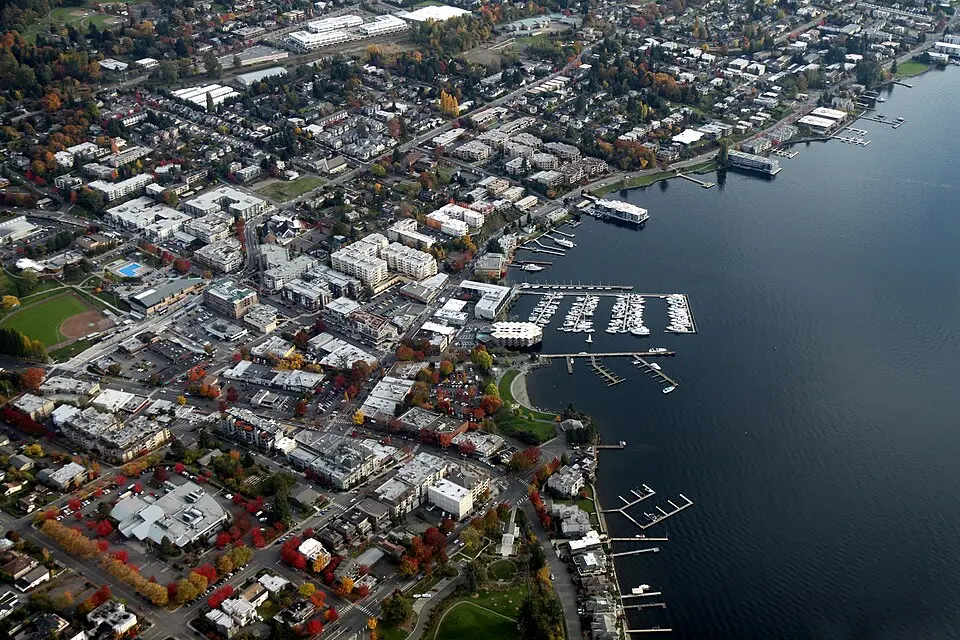
About Kirkland, WA
Kirkland, a city on the eastern shore of Lake Washington, boasts a vibrant waterfront and arts scene. Once a major steel producer, it's now a affluent residential community. With a safety score of 38/100 and a population coverage of 90,687, Kirkland has a total crime rate of 2,073.1 per 100,000 residents.
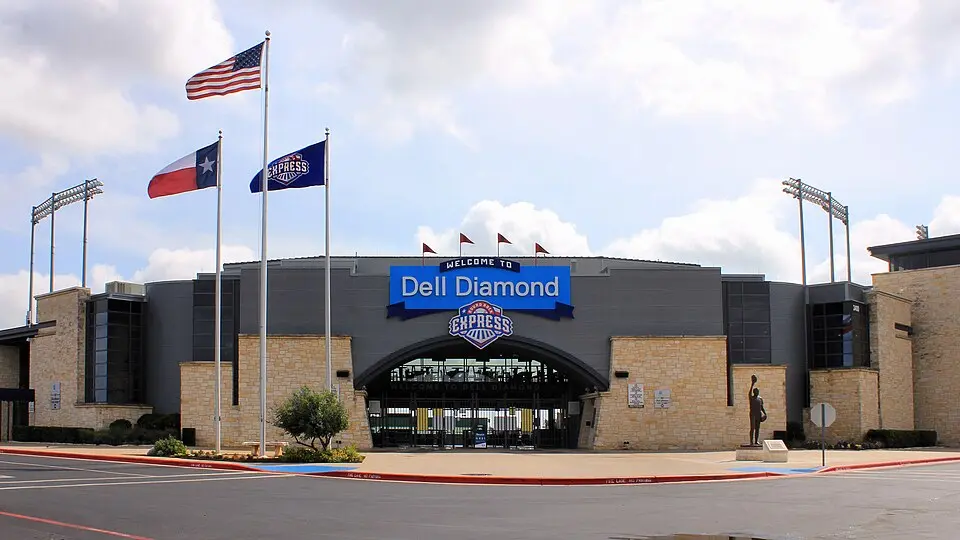
About Round Rock, TX
Round Rock, home to Dell Technologies, is a growing city north of Austin. Situated on the Balcones Escarpment, it blends suburban development with natural features along Brushy Creek. Its population has surged, nearing 120,000 residents. With a safety score of 38/100 and a population coverage of 133,868, Round Rock has a total crime rate of 2,071.4 per 100,000 residents.