Is Leawood or San Juan Safer?
According to crimebycity.com's analysis of 2024 FBI data, San Juan is safer than Leawood (Safety Score 54/100 vs 54/100), with a total crime rate of 1,578 per 100,000 versus 1,579 for Leawood — 0% lower. Leawood has lower rates in 4 of 7 crime categories.
The biggest difference is in murder, where Leawood has a 100% lower rate.
Leawood — 5-Year Trend
 Violent
Property
Total
Violent
Property
Total
San Juan — 5-Year Trend
 Violent
Property
Total
Violent
Property
Total
Leawood, KS
San Juan, TX
Detailed Crime Rate Comparison
| Crime Type | Leawood | San Juan | Difference |
|---|---|---|---|
| Total Crime Rate | 1,579.0 | 1,578.0 | +1.0 |
| Violent Crime Rate | 58.8 | 160.2 | -101.4 |
| Murder Rate | 0.0 | 8.2 | -8.2 |
| Rape Rate | 2.9 | 0.0 | +2.9 |
| Robbery Rate | 5.9 | 29.9 | -24.0 |
| Aggravated Assault Rate | 50.0 | 116.8 | -66.8 |
| Property Crime Rate | 1,520.1 | 1,417.8 | +102.4 |
| Burglary Rate | 141.1 | 228.1 | -87.0 |
| Larceny-Theft Rate | 1,211.4 | 1,108.1 | +103.3 |
| Motor Vehicle Theft Rate | 167.6 | 81.5 | +86.1 |
All rates per 100,000 residents. Source: FBI UCR 2024.
Frequently Asked Questions
Is Leawood or San Juan safer?
San Juan is safer with a total crime rate of 1,578 per 100K vs 1,579 for Leawood — a 0% difference.
How do violent crime rates compare?
Leawood has a violent crime rate of 58.8 per 100K while San Juan has 160.2. Leawood has lower violent crime.
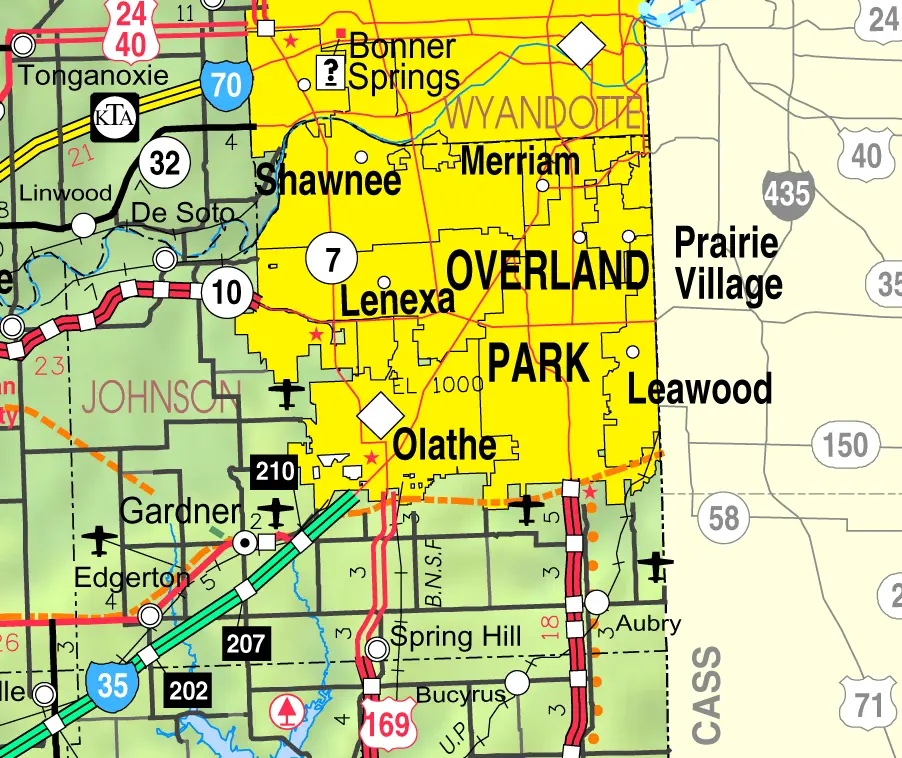
About Leawood, KS
Leawood, Kansas, a affluent suburb of Kansas City, is known for its tree-lined streets and spacious homes. Developed in the 1920s by Oscar G. Lee, it attracts many professionals and families. Its eastern border abuts the Missouri state line. With a safety score of 54/100 and a population coverage of 34,010, Leawood has a total crime rate of 1,579.0 per 100,000 residents.
About San Juan, TX
San Juan, Texas, part of the Rio Grande Valley, has a rich Hispanic heritage, evident in its vibrant community and local businesses. This South Texas city is situated near the U.S.-Mexico border and is home to a growing population. With a safety score of 54/100 and a population coverage of 36,819, San Juan has a total crime rate of 1,578.0 per 100,000 residents.