Is Plymouth or Simi Valley Safer?
According to crimebycity.com's analysis of 2024 FBI data, Simi Valley is safer than Plymouth (Safety Score 72/100 vs 71/100), with a total crime rate of 1,053 per 100,000 versus 1,075 for Plymouth — 2% lower. Plymouth has lower rates in 4 of 7 crime categories.
The biggest difference is in murder, where Plymouth has a 100% lower rate.
Plymouth — 5-Year Trend
 Violent
 Property
Total
Property
Total
Simi Valley — 5-Year Trend
Violent
 Property
Total
Property
Total
Plymouth, MN
Simi Valley, CA
Detailed Crime Rate Comparison
| Crime Type | Plymouth | Simi Valley | Difference |
|---|---|---|---|
| Total Crime Rate | 1,074.7 | 1,052.9 | +21.9 |
| Violent Crime Rate | 50.9 | 129.1 | -78.2 |
| Murder Rate | 0.0 | 2.4 | -2.4 |
| Rape Rate | 3.9 | 15.2 | -11.3 |
| Robbery Rate | 13.1 | 24.9 | -11.8 |
| Aggravated Assault Rate | 34.0 | 86.6 | -52.7 |
| Property Crime Rate | 1,023.8 | 923.8 | +100.0 |
| Burglary Rate | 134.5 | 124.3 | +10.2 |
| Larceny-Theft Rate | 830.5 | 714.5 | +116.1 |
| Motor Vehicle Theft Rate | 58.8 | 85.0 | -26.2 |
All rates per 100,000 residents. Source: FBI UCR 2024.
Frequently Asked Questions
Is Plymouth or Simi Valley safer?
Simi Valley is safer with a total crime rate of 1,053 per 100K vs 1,075 for Plymouth — a 2% difference.
How do violent crime rates compare?
Plymouth has a violent crime rate of 50.9 per 100K while Simi Valley has 129.1. Plymouth has lower violent crime.
About Plymouth, MN
Plymouth, Minnesota, a large suburb west of Minneapolis, is known for its extensive park system and as the former home of Tonka Toys. It consistently ranks among the best places to live in the US for its quality of life and natural beauty. With a safety score of 71/100 and a population coverage of 76,577, Plymouth has a total crime rate of 1,074.7 per 100,000 residents.
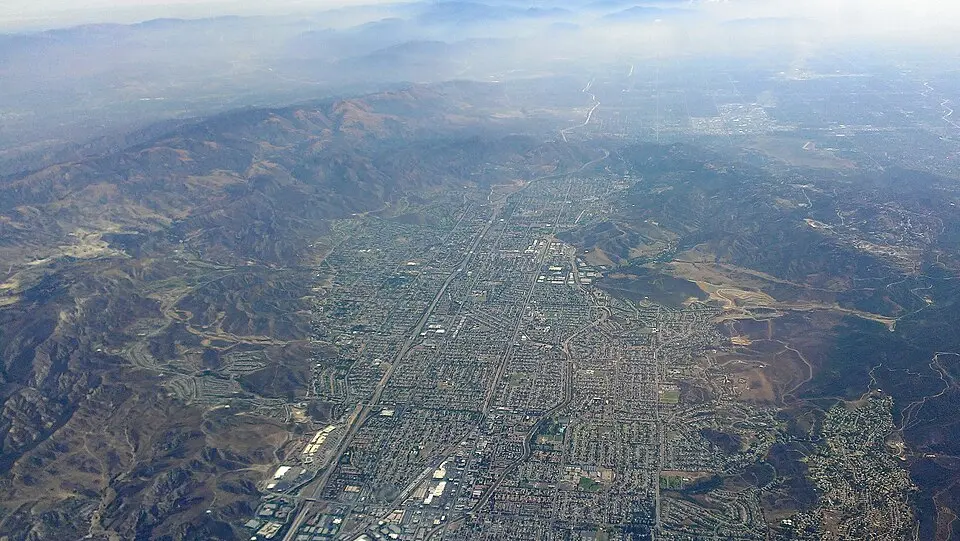
About Simi Valley, CA
Nestled in a valley, Simi Valley is a suburban community known for the Ronald Reagan Presidential Library. It's primarily a residential area with a significant commuter population. With a safety score of 72/100 and a population coverage of 124,707, Simi Valley has a total crime rate of 1,052.9 per 100,000 residents.